Affirm Investor Day Presentation Deck
NOVEMBER 2023
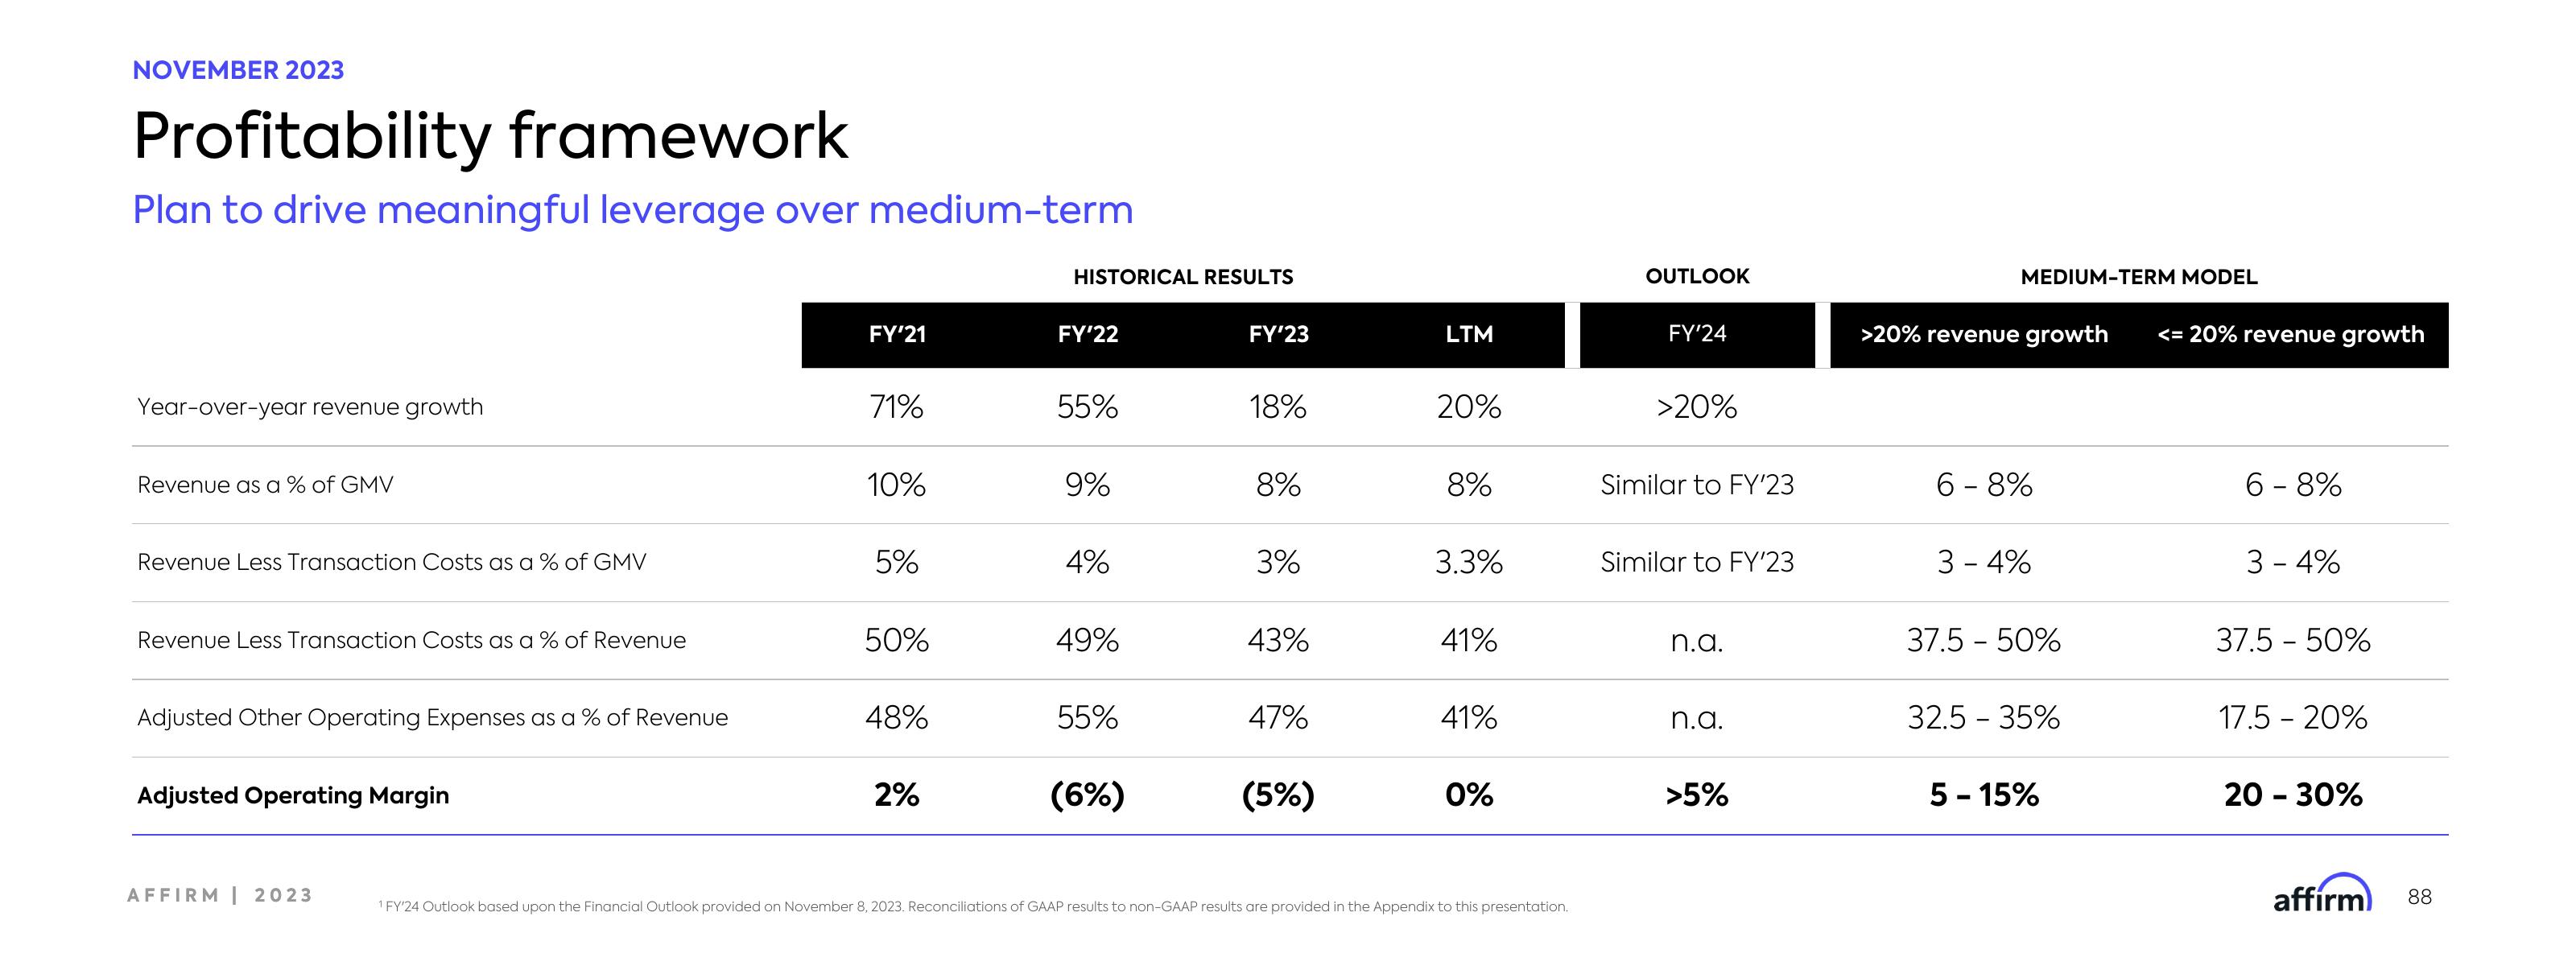
Profitability framework
Plan to drive meaningful leverage over medium-term
Year-over-year revenue growth
Revenue as a % of GMV
Revenue Less Transaction Costs as a % of GMV
Revenue Less Transaction Costs as a % of Revenue
Adjusted Other Operating Expenses as a % of Revenue
Adjusted Operating Margin
AFFIRM | 2023
FY'21
71%
10%
5%
50%
48%
2%
HISTORICAL RESULTS
FY'22
55%
9%
4%
49%
55%
(6%)
FY'23
18%
8%
3%
43%
47%
(5%)
LTM
20%
8%
3.3%
41%
41%
0%
1 FY'24 Outlook based upon the Financial Outlook provided on November 8, 2023. Reconciliations of GAAP results to non-GAAP results are provided in the Appendix to this presentation.
OUTLOOK
FY'24
>20%
Similar to FY'23
Similar to FY'23
n.a.
n.a.
>5%
MEDIUM-TERM MODEL
>20% revenue growth
6 - 8%
3 - 4%
37.5 - 50%
32.5 - 35%
5 - 15%
<= 20% revenue growth
6 - 8%
3 - 4%
37.5 - 50%
17.5 - 20%
20 - 30%
affirm
88View entire presentation