Zegna SPAC Presentation Deck
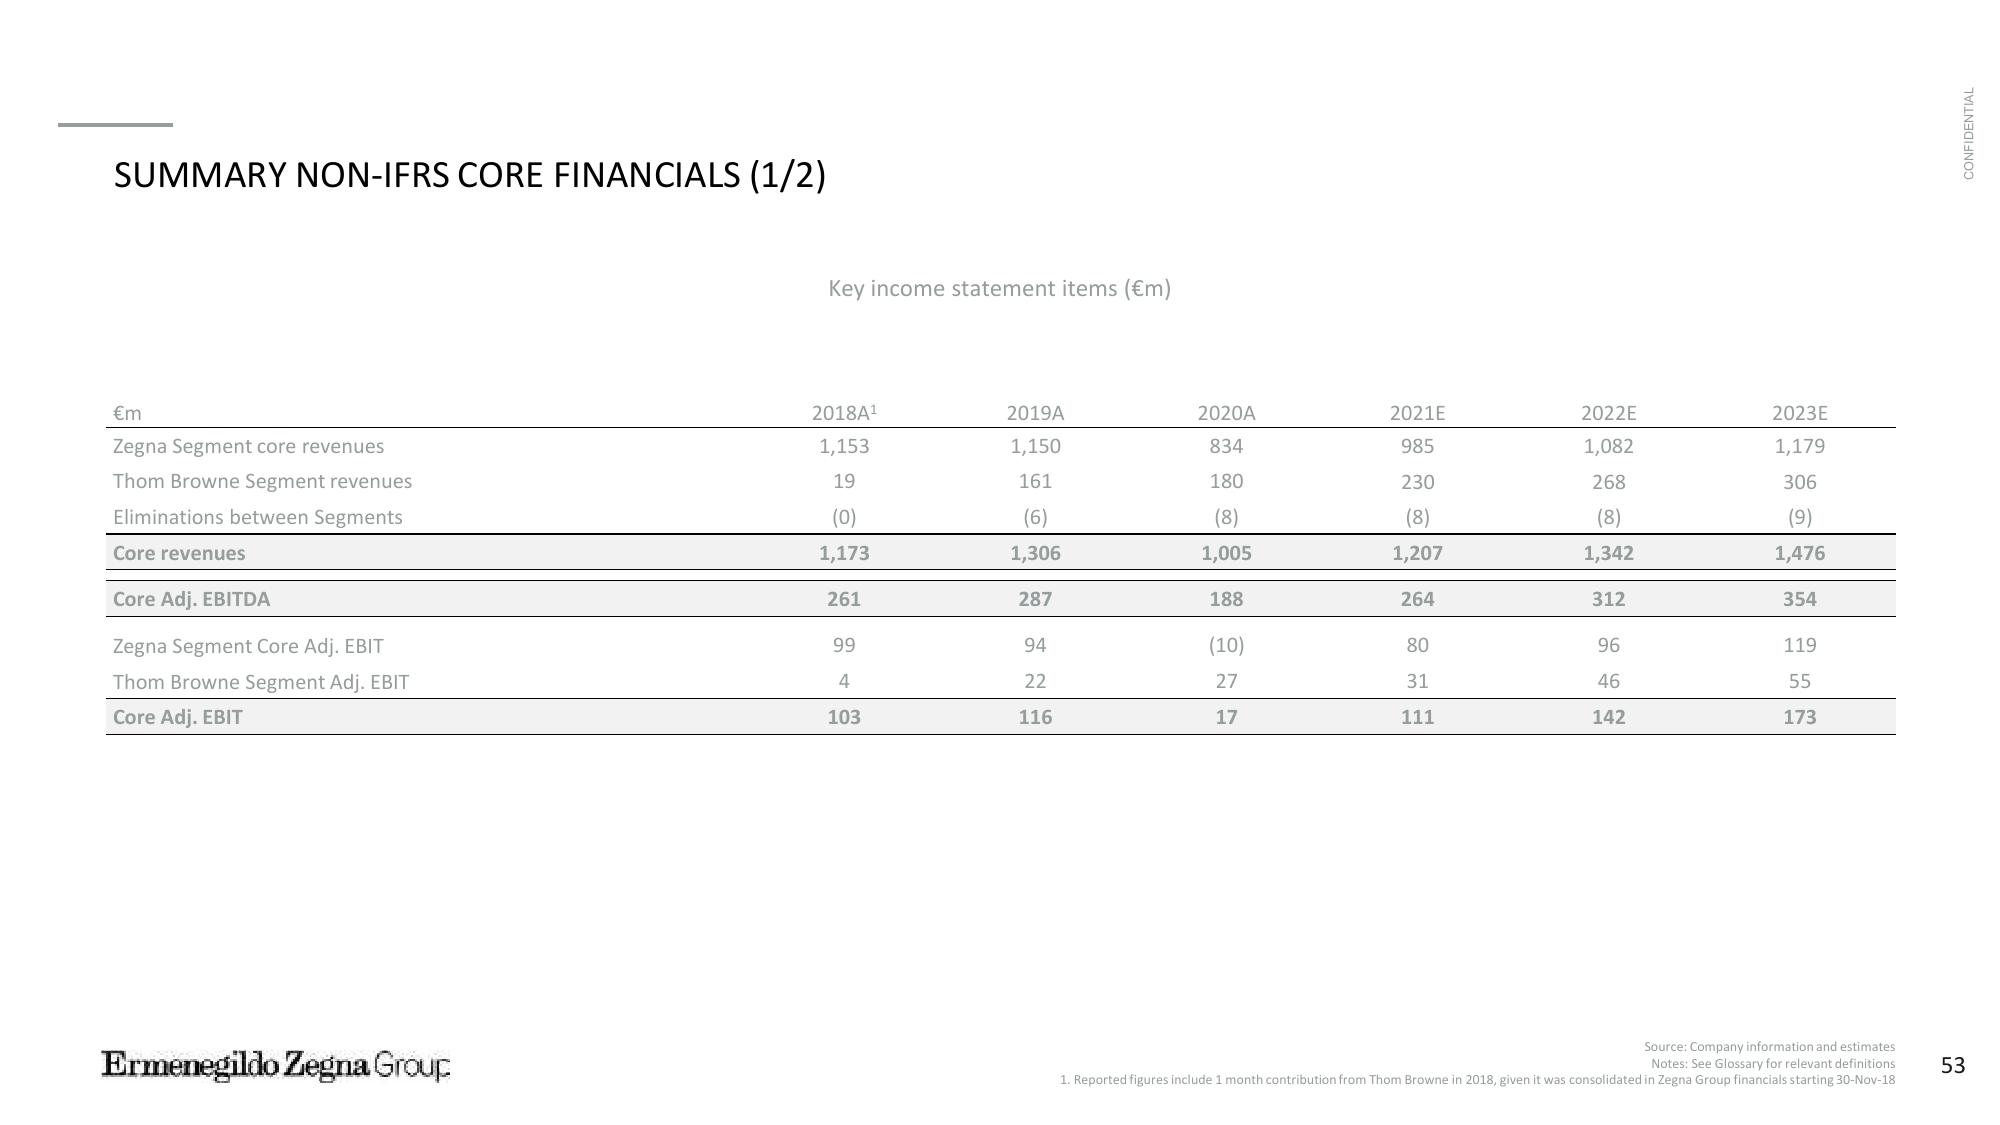
SUMMARY NON-IFRS CORE FINANCIALS (1/2)
€m
Zegna Segment core revenues
Thom Browne Segment revenues
Eliminations between Segments
Core revenues
Core Adj. EBITDA
Zegna Segment Core Adj. EBIT
Thom Browne Segment Adj. EBIT
Core Adj. EBIT
Ermenegildo Zegna Group
Key income statement items (€m)
2018A¹
1,153
19
(0)
1,173
261
99
4
103
2019A
1,150
161
(6)
1,306
287
94
22
116
2020A
834
180
(8)
1,005
188
(10)
27
17
2021E
985
230
(8)
1,207
264
80
31
111
2022E
1,082
268
(8)
1,342
312
96
46
142
2023E
1,179
306
(9)
1,476
354
119
55
173
Source: Company information and estimates
Notes: See Glossary for relevant definitions
1. Reported figures include 1 month contribution from Thom Browne in 2018, given it was consolidated in Zegna Group financials starting 30-Nov-18
CONFIDENTIAL
53View entire presentation