UBS Results Presentation Deck slide image

UBS Results Presentation Deck

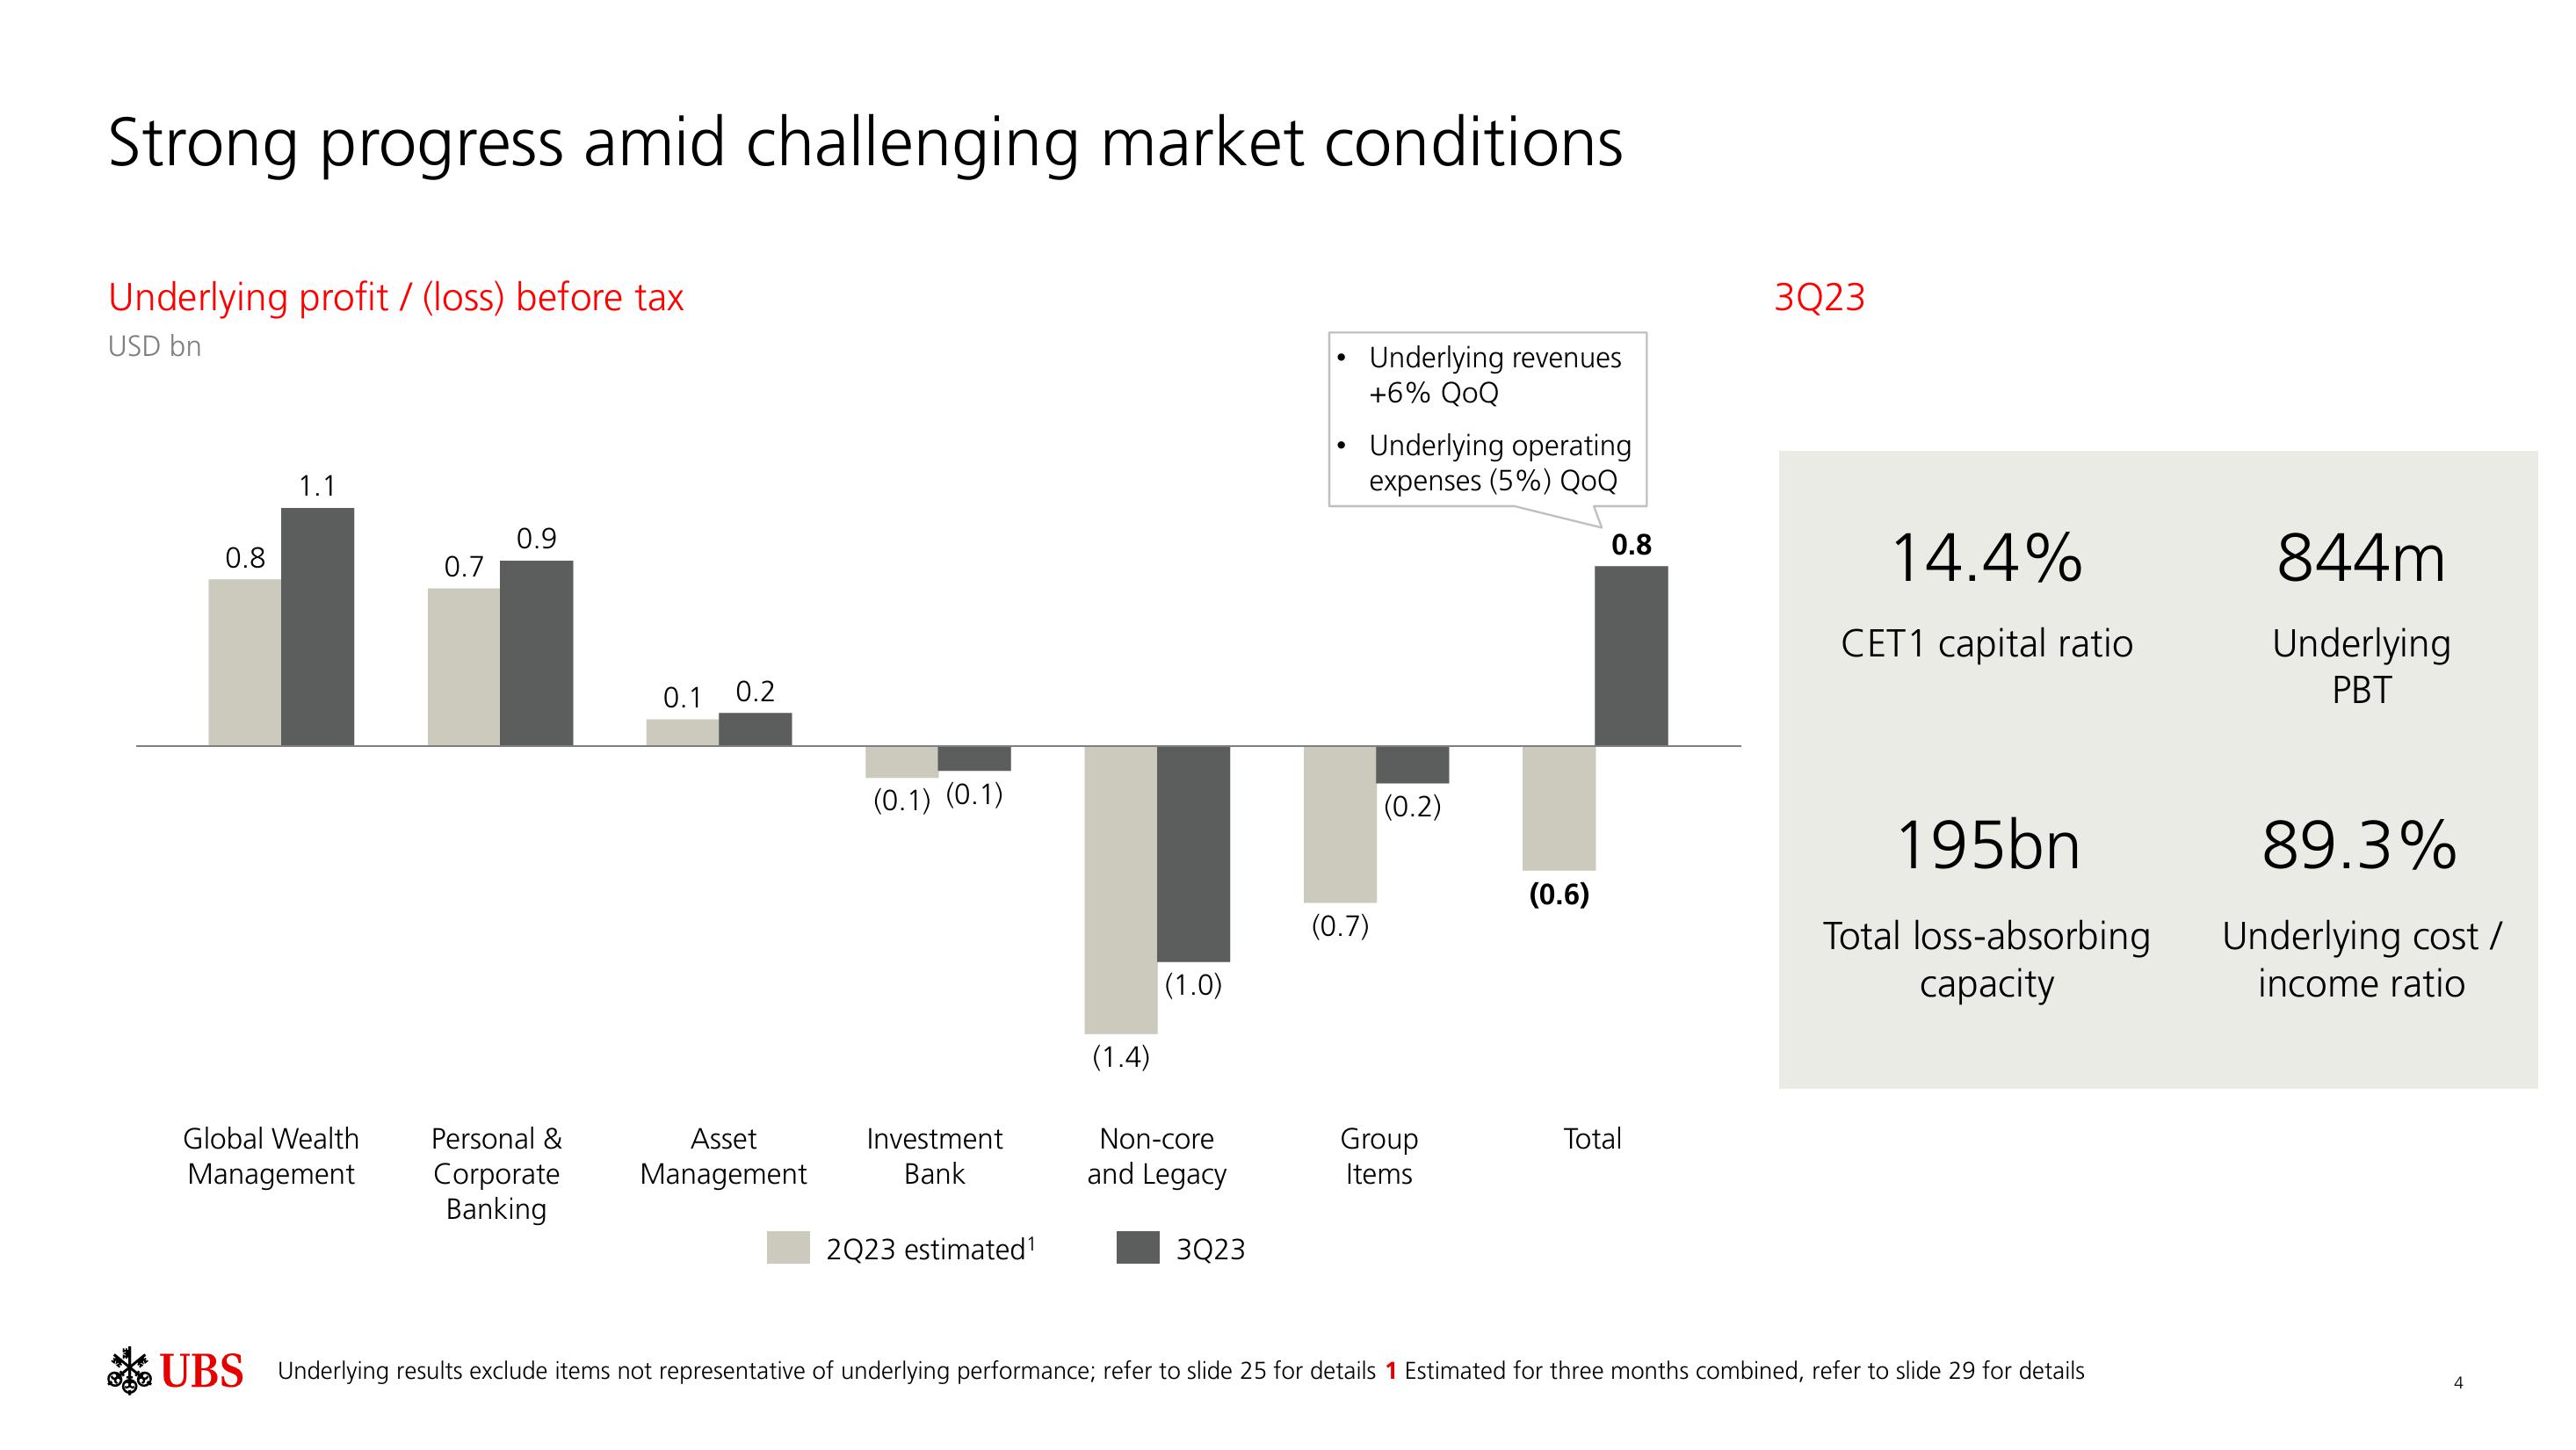
Strong progress amid challenging market conditions Underlying profit / (loss) before tax USD bn 0.8 1.1 Global Wealth Management 0.7 0.9 Personal & Corporate Banking 0.1 0.2 Asset Management (0.1) (0.1) Investment Bank 2Q23 estimated ¹ (1.4) (1.0) Non-core and Legacy 3Q23 ● ● Underlying revenues +6% QOQ Underlying operating expenses (5%) QoQ (0.7) (0.2) Group Items (0.6) 0.8 Total 3Q23 14.4% CET1 capital ratio 195bn Total loss-absorbing capacity UBS Underlying results exclude items not representative of underlying performance; refer to slide 25 for details 1 Estimated for three months combined, refer to slide 29 for details 844m Underlying PBT 89.3% Underlying cost / income ratio 4
View entire presentation