WeWork SPAC Presentation Deck
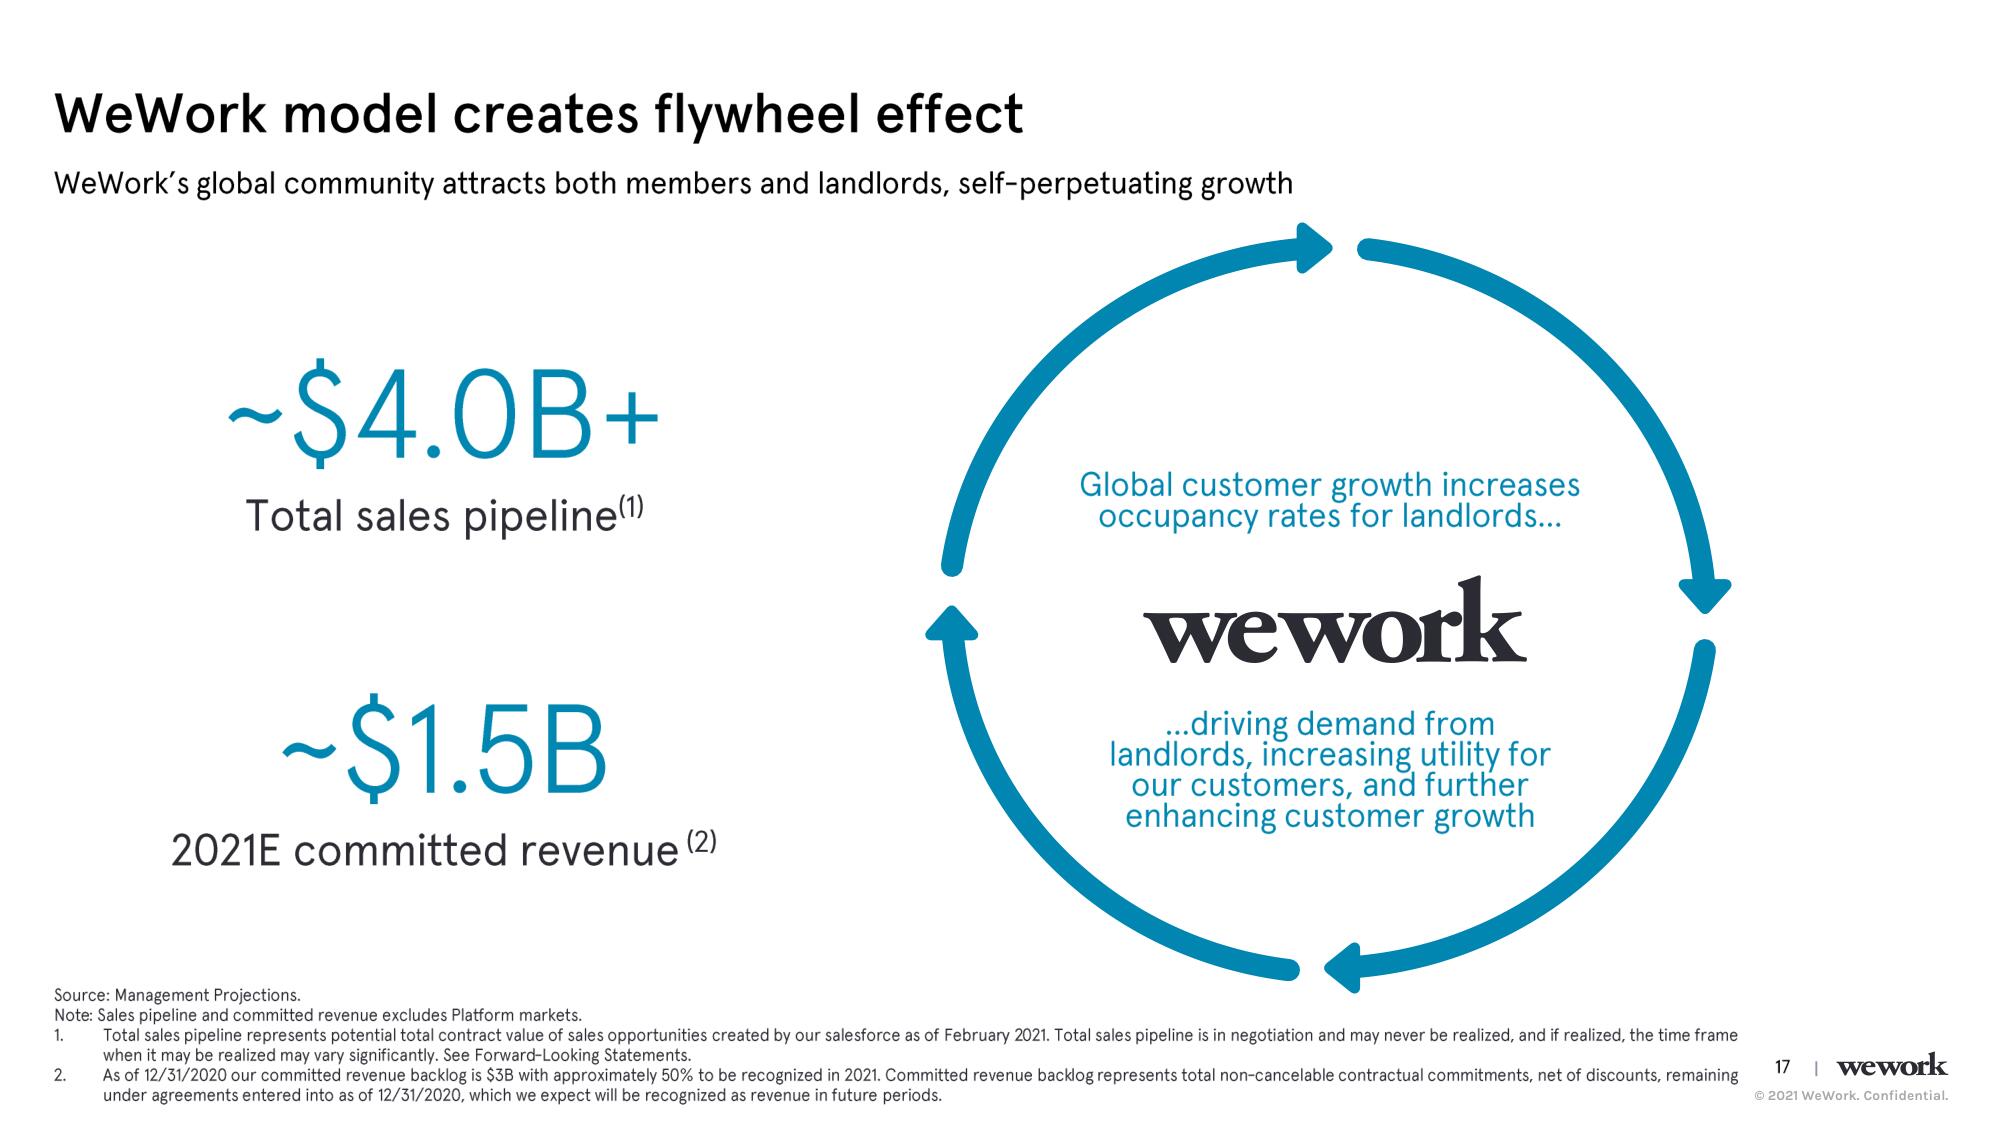
WeWork model creates flywheel effect
WeWork's global community attracts both members and landlords, self-perpetuating growth
~$4.OB+
Total sales pipeline(1)
2.
~$1.5B
2021E committed revenue
(2)
Global customer growth increases
occupancy rates for landlords...
wework
...driving demand from
landlords, increasing utility for
our customers, and further
enhancing customer growth
Source: Management Projections.
Note: Sales pipeline and committed revenue excludes Platform markets.
1.
Total sales pipeline represents potential total contract value of sales opportunities created by our salesforce as of February 2021. Total sales pipeline is in negotiation and may never be realized, and if realized, the time frame
when it may be realized may vary significantly. See Forward-Looking Statements.
As of 12/31/2020 our committed revenue backlog is $3B with approximately 50% to be recognized in 2021. Committed revenue backlog represents total non-cancelable contractual commitments, net of discounts, remaining
under agreements entered into as of 12/31/2020, which we expect will be recognized as revenue in future periods.
17 | wework
Ⓒ2021 WeWork. Confidential.View entire presentation