Adani Green Energy Limited
Profitable Growth Leading to Superior Returns
1.
2.
3.
4.
5.
Capacity
(in MW)
Operational Portfolio
4
Solar
Wind5
Total
adani
Renewables
Average
Tariff
(in Rs/kWh)
Completed/
Expected Project
Cost¹
(in Rs Cr)
Revenue²
(in Rs Cr)
2 & 3
EBITDA³
(in Rs Cr)
Capex/ EBITDA
2,148
4.82
13,156
2,322
2,193
6.00
172
3.87
1,035
182
172
6.03
2,320
4.75
14,191
2,504
2,365
6.00
Under Construction Portfolio
Solar
475
2.77
1,934
321
298
6.50
Wind5
1,505
2.69
8,703
1,406
1,332
6.53
Hybrid
990
2.69
5,220
901
840
6.21
Total
2,970
2.70
15,857
2,627
2,470
6.42
Portfolio Total
5,290
3.60
30,047
5,131
4,835
6.22
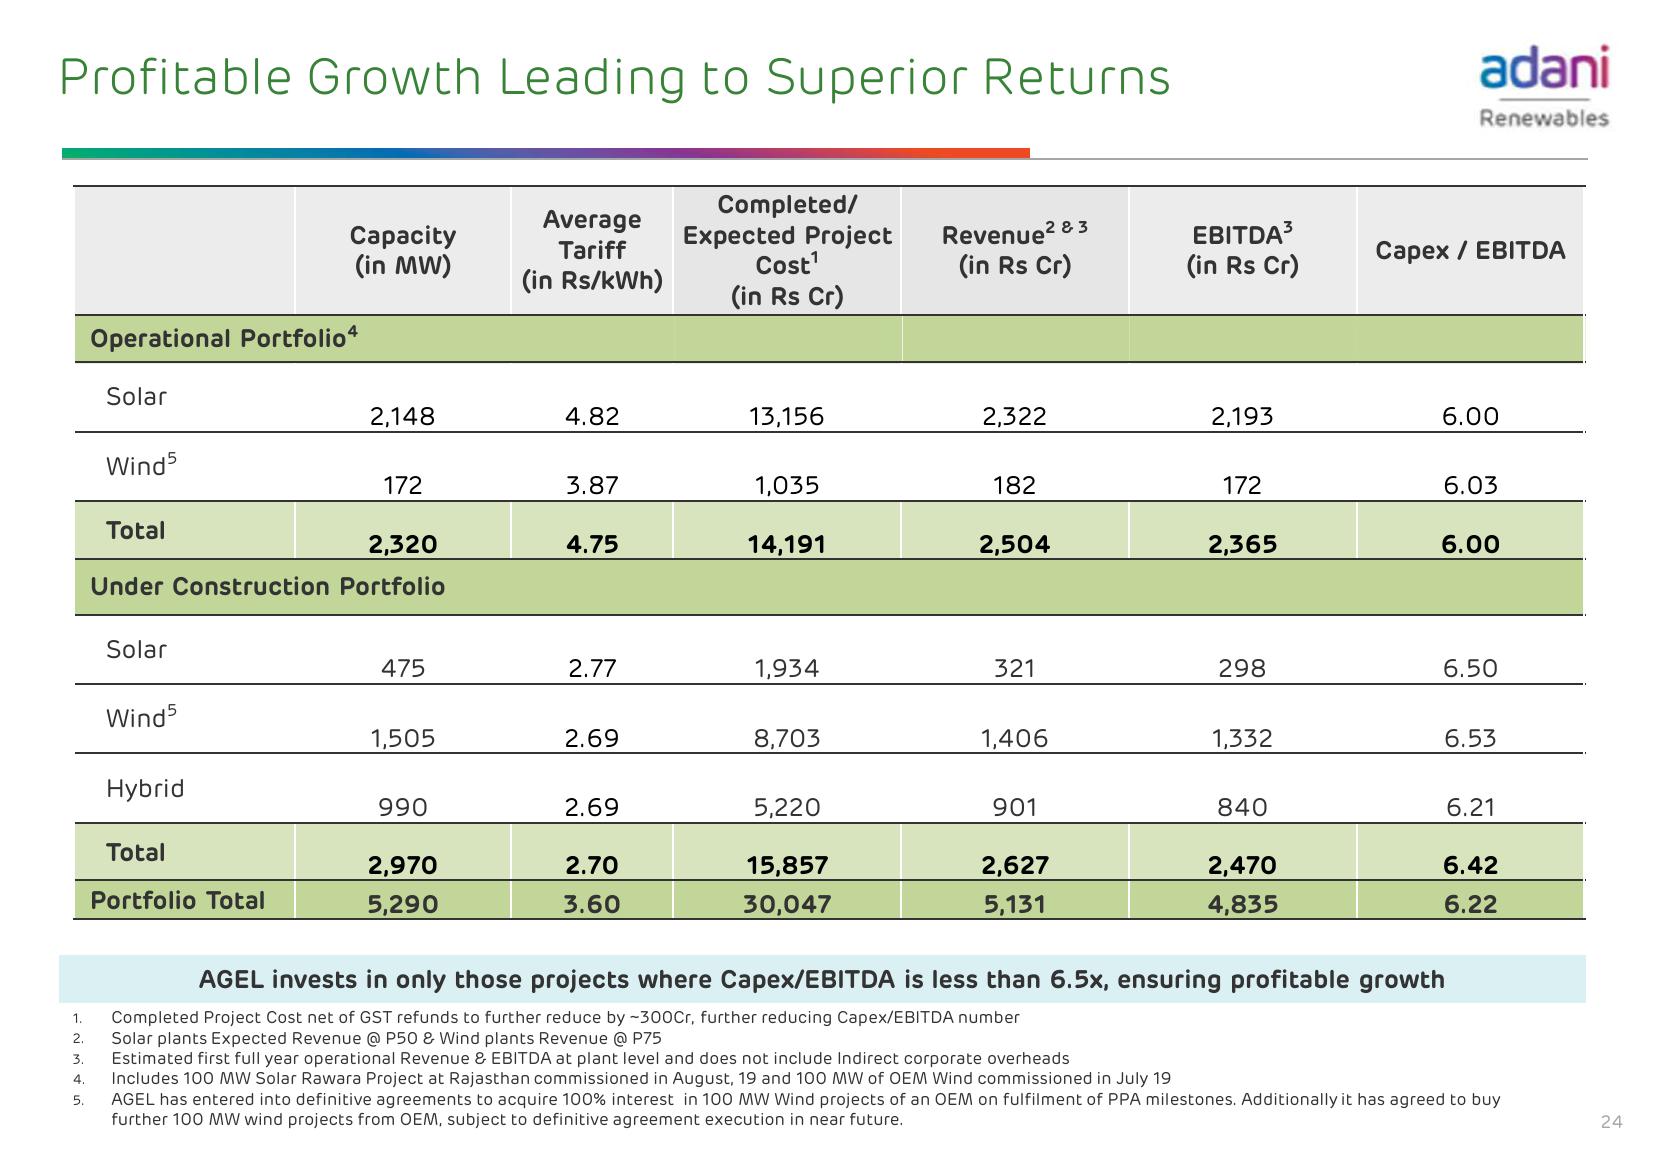
AGEL invests in only those projects where Capex/EBITDA is less than 6.5x, ensuring profitable growth
Completed Project Cost net of GST refunds to further reduce by -300Cr, further reducing Capex/EBITDA number
Solar plants Expected Revenue @ P50 & Wind plants Revenue @ P75
Estimated first full year operational Revenue & EBITDA at plant level and does not include Indirect corporate overheads
Includes 100 MW Solar Rawara Project at Rajasthan commissioned in August, 19 and 100 MW of OEM Wind commissioned in July 19
AGEL has entered into definitive agreements to acquire 100% interest in 100 MW Wind projects of an OEM on fulfilment of PPA milestones. Additionally it has agreed to buy
further 100 MW wind projects from OEM, subject to definitive agreement execution in near future.
24View entire presentation