Paycor Investor Presentation Deck
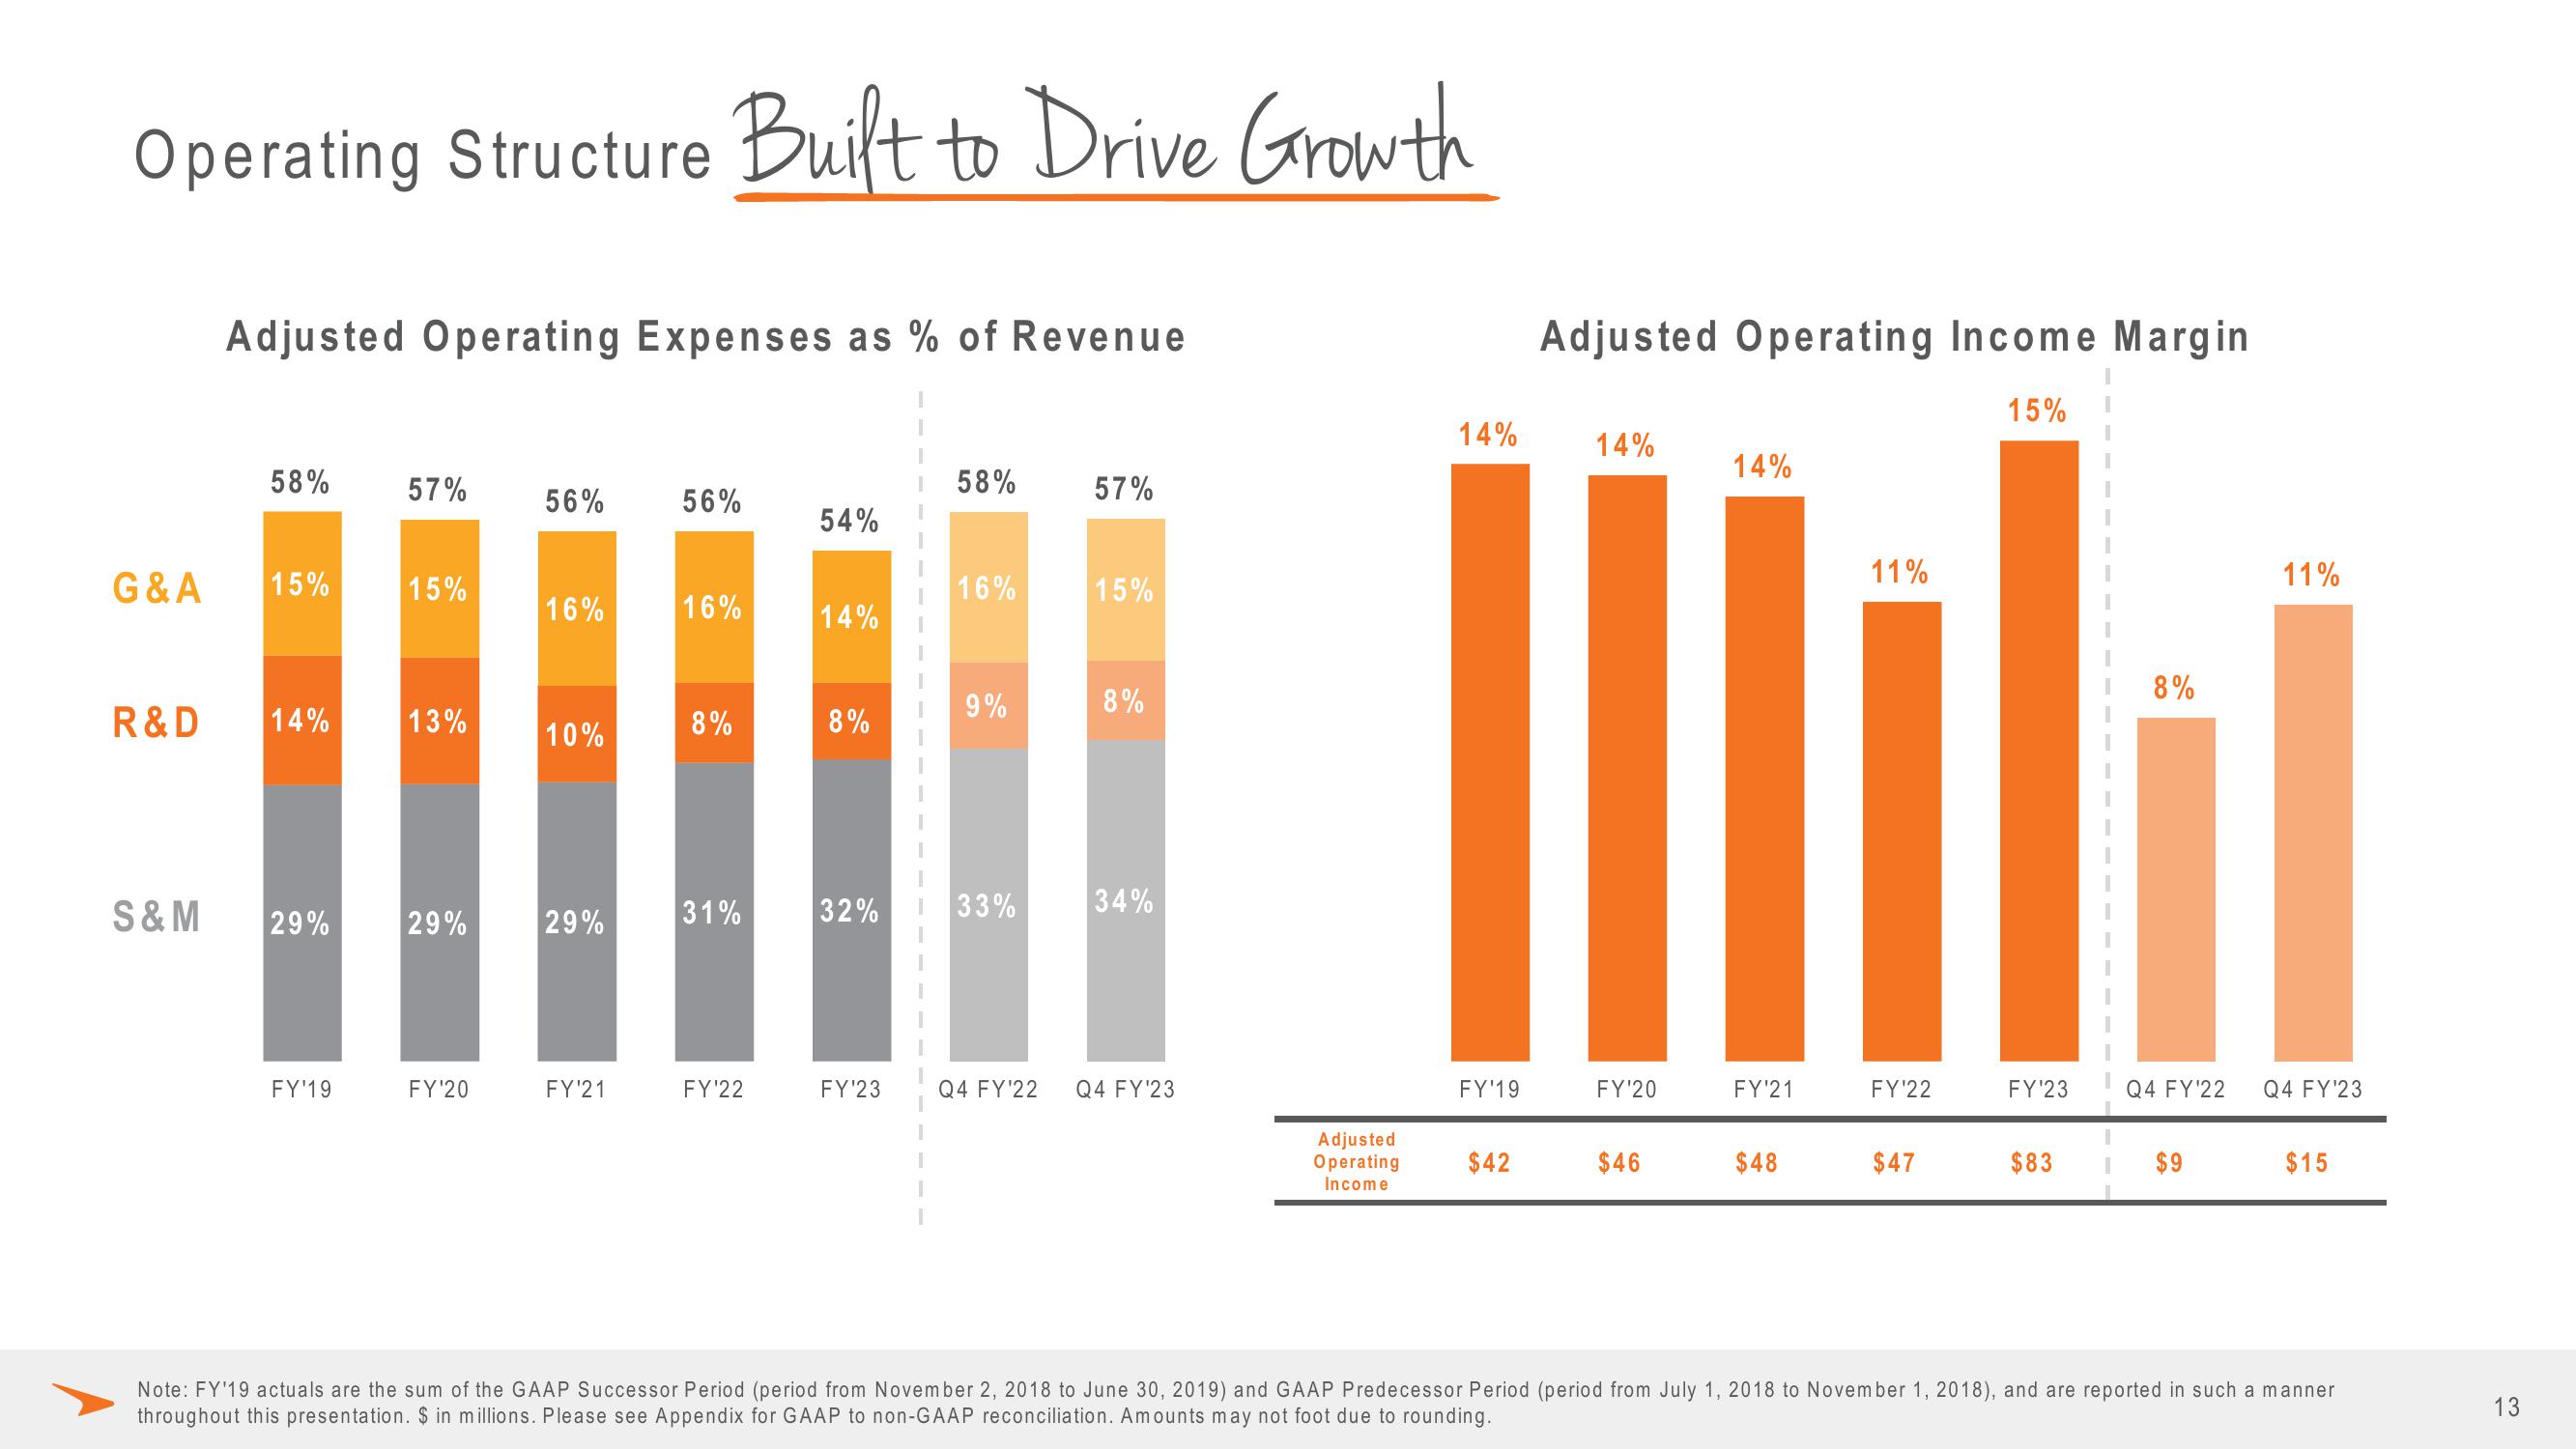
Operating Structure Built to Drive Growth
G&A
Adjusted Operating Expenses as % of Revenue
S&M
58%
15%
R&D 14%
29%
FY¹19
57%
15%
13%
29%
FY'20
56%
16%
10%
29%
FY'21
56%
16%
8%
31%
FY'22
54%
14%
8%
32%
FY¹23
58%
16%
9%
33%
57%
15%
8%
34%
Q4 FY'22 Q4 FY¹23
Adjusted
Operating
Income
14%
FY¹19
$42
Adjusted Operating Income Margin
15%
14%
FY'20
$46
14%
FY¹21
$48
11%
FY'22
$47
FY¹23
$83
8%
11%
Q4 FY'22 Q4 FY'23
$9
$15
Note: FY'19 actuals are the sum of the GAAP Successor Period (period from November 2, 2018 to June 30, 2019) and GAAP Predecessor Period (period from July 1, 2018 to November 1, 2018), and are reported in such a manner
throughout this presentation. $ in millions. Please see Appendix for GAAP to non-GAAP reconciliation. Amounts may not foot due to rounding.
13View entire presentation