Sonos Results Presentation Deck
Cash Flow & Balance Sheet Highlights
Cash flow from operations
Capital expenditures
% of revenue
Free cash flow
Free cash flow / Adj EBITDA
Ending cash & cash equivalents
Total debt
1Q23
$ 182.3
$14.7
2.2%
$167.6
135%
$ 431.5
$-
1Q22
$ 179.9
$6.4
1.0%
$ 173.6
106%
$ 754.4
$-
Y/Y Change
1%
131%
(3)%
(43)%
N/A
●
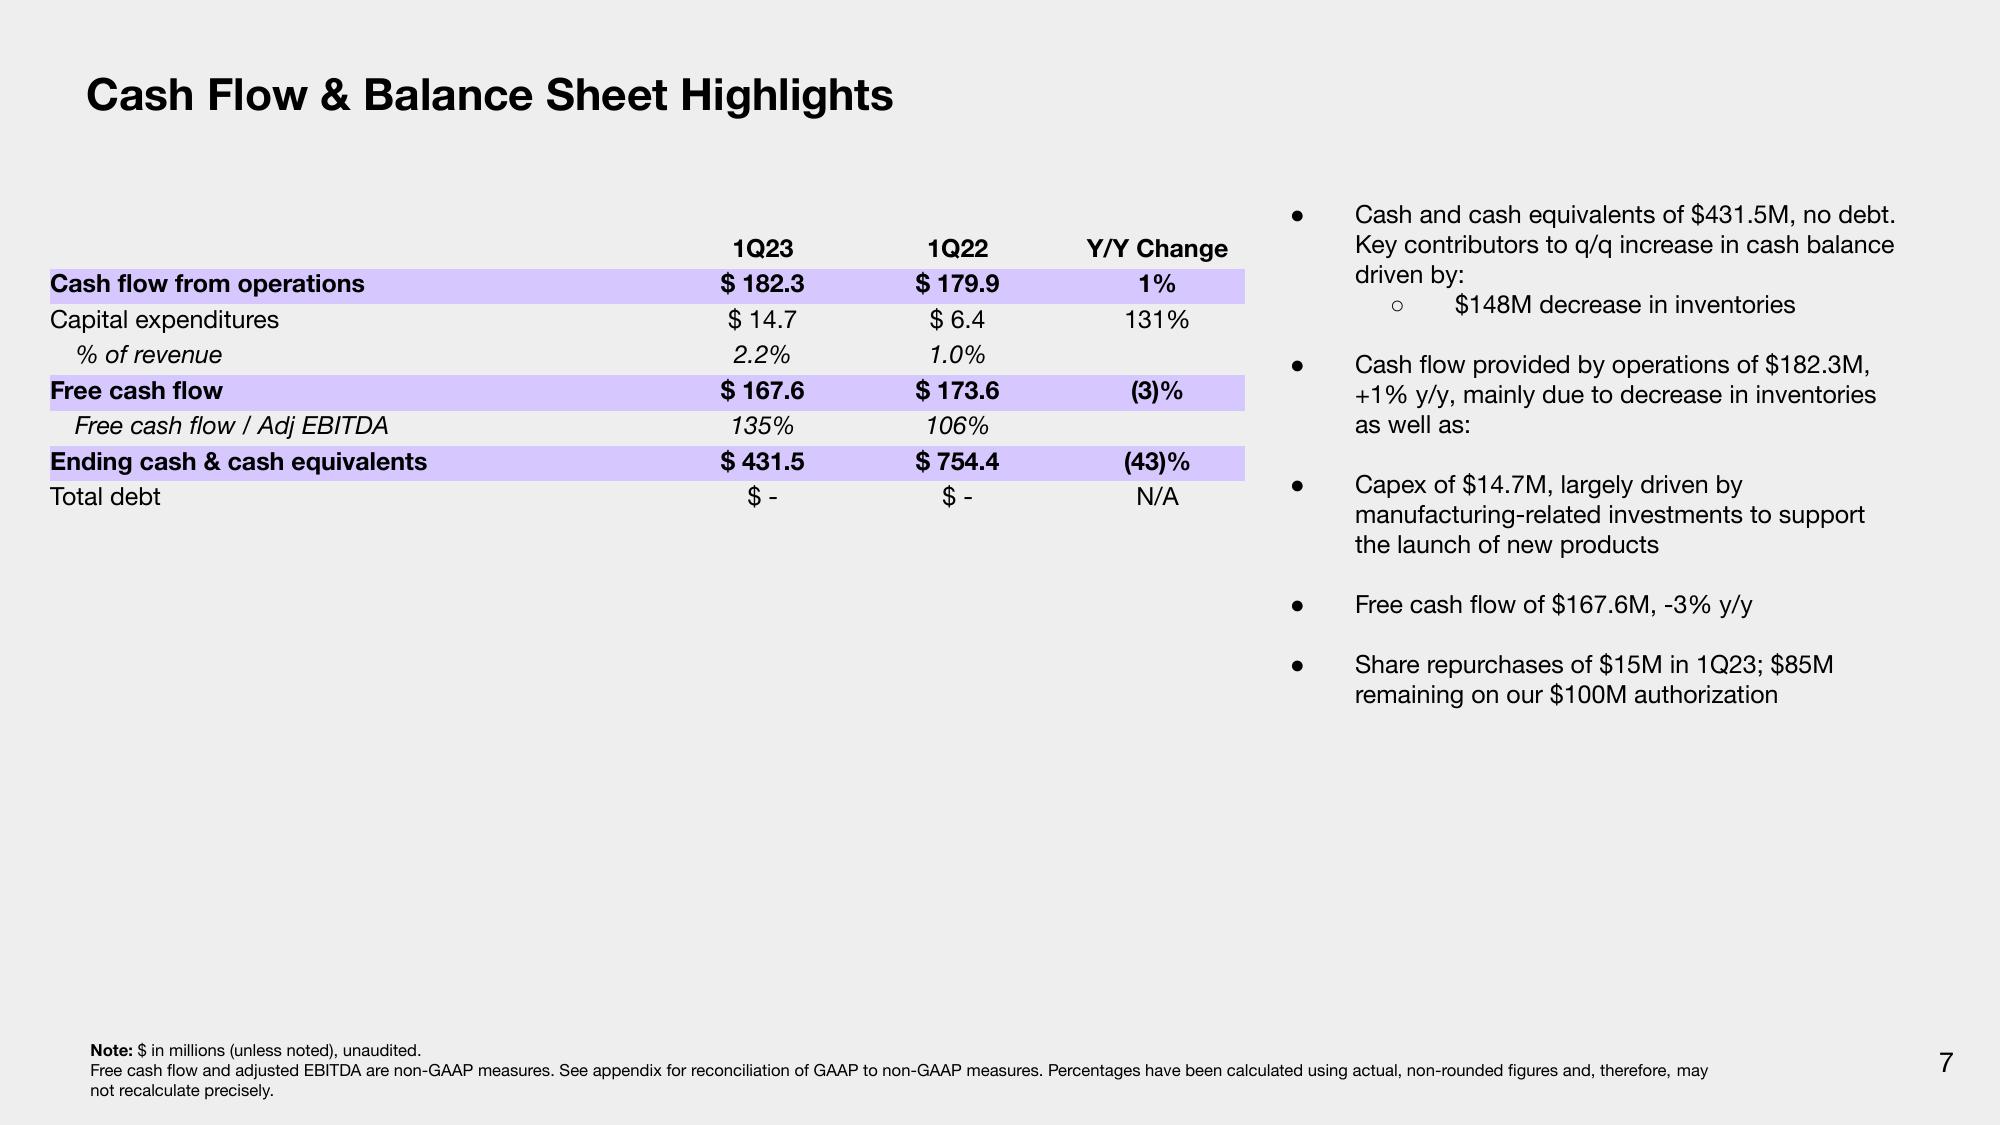
Cash and cash equivalents of $431.5M, no debt.
Key contributors to q/q increase in cash balance
driven by:
O
$148M decrease in inventories
Cash flow provided by operations of $182.3M,
+1% y/y, mainly due to decrease in inventories
as well as:
Capex of $14.7M, largely driven by
manufacturing-related investments to support
the launch of new products
Free cash flow of $167.6M, -3% y/y
Share repurchases of $15M in 1Q23; $85M
remaining on our $100M authorization
Note: $ in millions (unless noted), unaudited.
Free cash flow and adjusted EBITDA are non-GAAP measures. See appendix for reconciliation of GAAP to non-GAAP measures. Percentages have been calculated using actual, non-rounded figures and, therefore, may
not recalculate precisely.
7View entire presentation