Kinnevik Results Presentation Deck
Intro
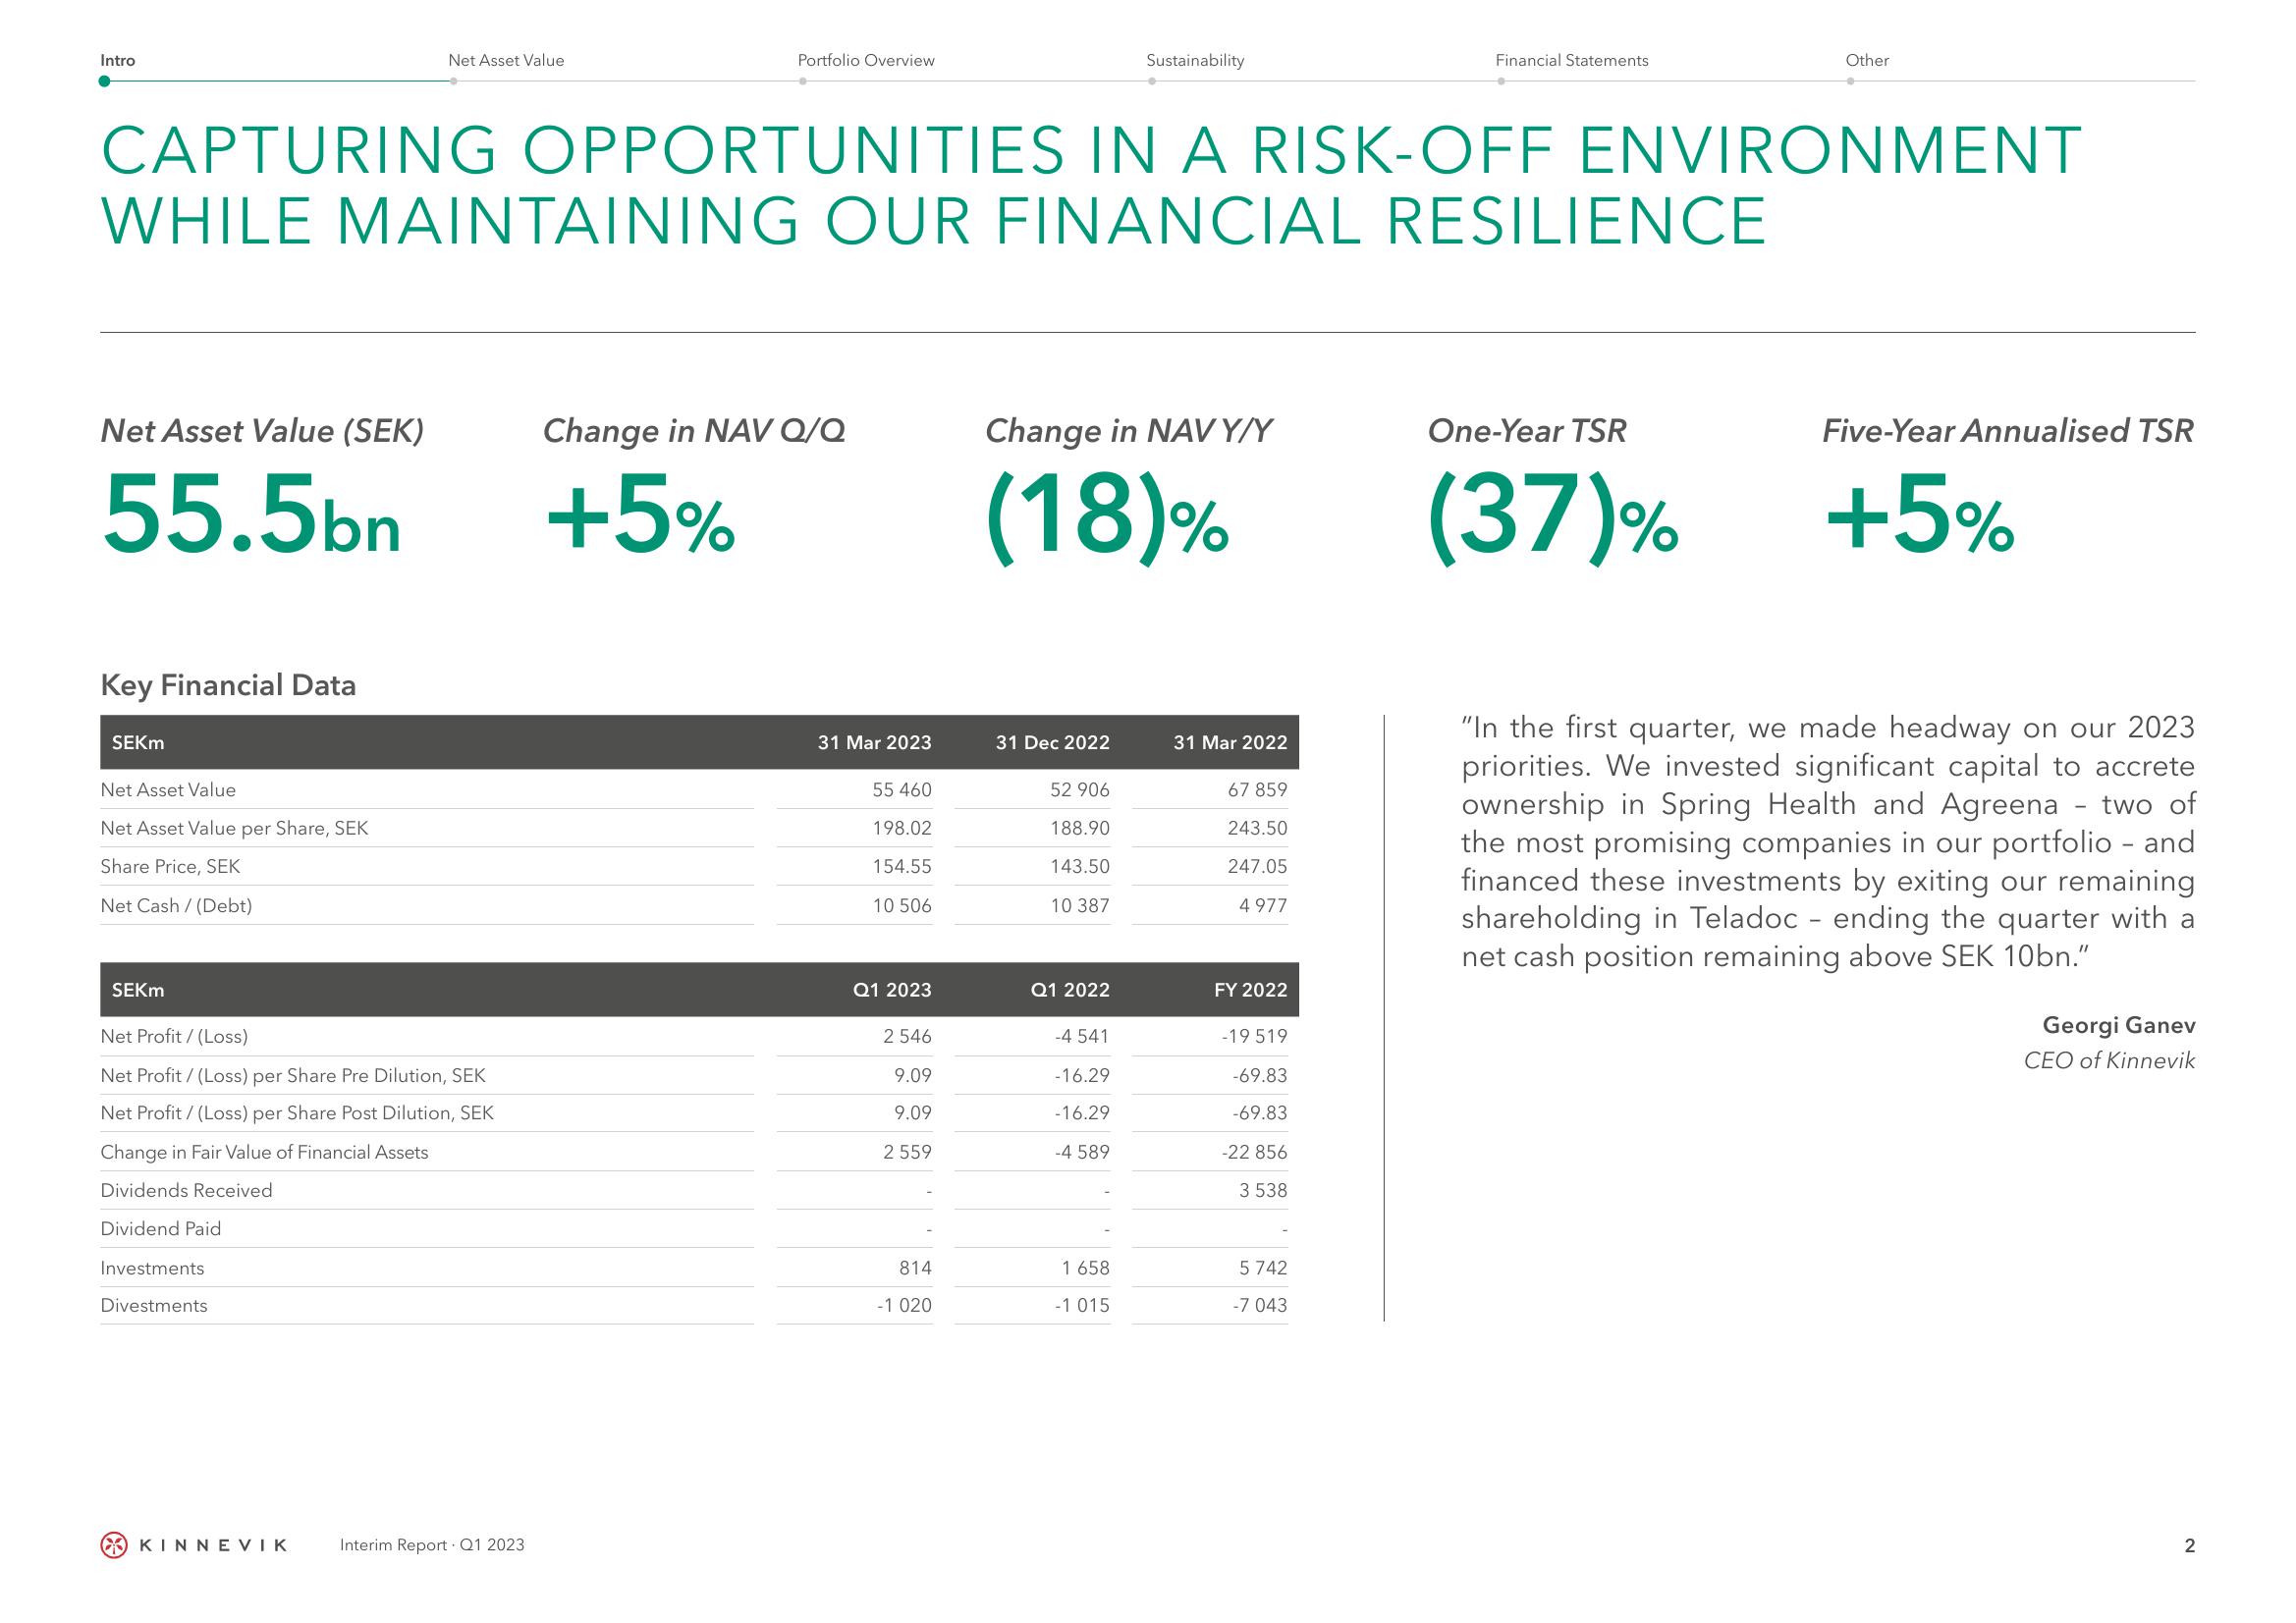
Net Asset Value (SEK)
55.5bn
Key Financial Data
SEKM
Net Asset Value
Net Asset Value per Share, SEK
Share Price, SEK
Net Cash/ (Debt)
CAPTURING OPPORTUNITIES IN A RISK-OFF ENVIRONMENT
WHILE MAINTAINING OUR FINANCIAL RESILIENCE
SEKM
Net Asset Value
Net Profit/(Loss)
Net Profit / (Loss) per Share Pre Dilution, SEK
Net Profit /(Loss) per Share Post Dilution, SEK
Change in Fair Value of Financial Assets
Dividends Received
Dividend Paid
Investments
Divestments
KINNEVIK
Portfolio Overview
Interim Report Q1 2023
Change in NAV Q/Q
+5%
31 Mar 2023
55 460
198.02
154.55
10 506
Q1 2023
2 546
9.09
9.09
2 559
814
-1 020
Change in NAVY/Y
(18)%
31 Dec 2022
52 906
188.90
143.50
10 387
Q1 2022
-4 541
-16.29
-16.29
Sustainability
-4 589
1 658
-1 015
31 Mar 2022
67 859
243.50
247.05
4977
FY 2022
-19 519
-69.83
-69.83
-22 856
3 538
Financial Statements
5 742
-7 043
Other
One-Year TSR
(37)%
Five-Year Annualised TSR
+5%
"In the first quarter, we made headway on our 2023
priorities. We invested significant capital to accrete
ownership in Spring Health and Agreena two of
the most promising companies in our portfolio - and
financed these investments by exiting our remaining
shareholding in Teladoc - ending the quarter with a
net cash position remaining above SEK 10bn."
Georgi Ganev
CEO of Kinnevik
2View entire presentation