Despegar Investor Day Presentation Deck
DESPEGAR
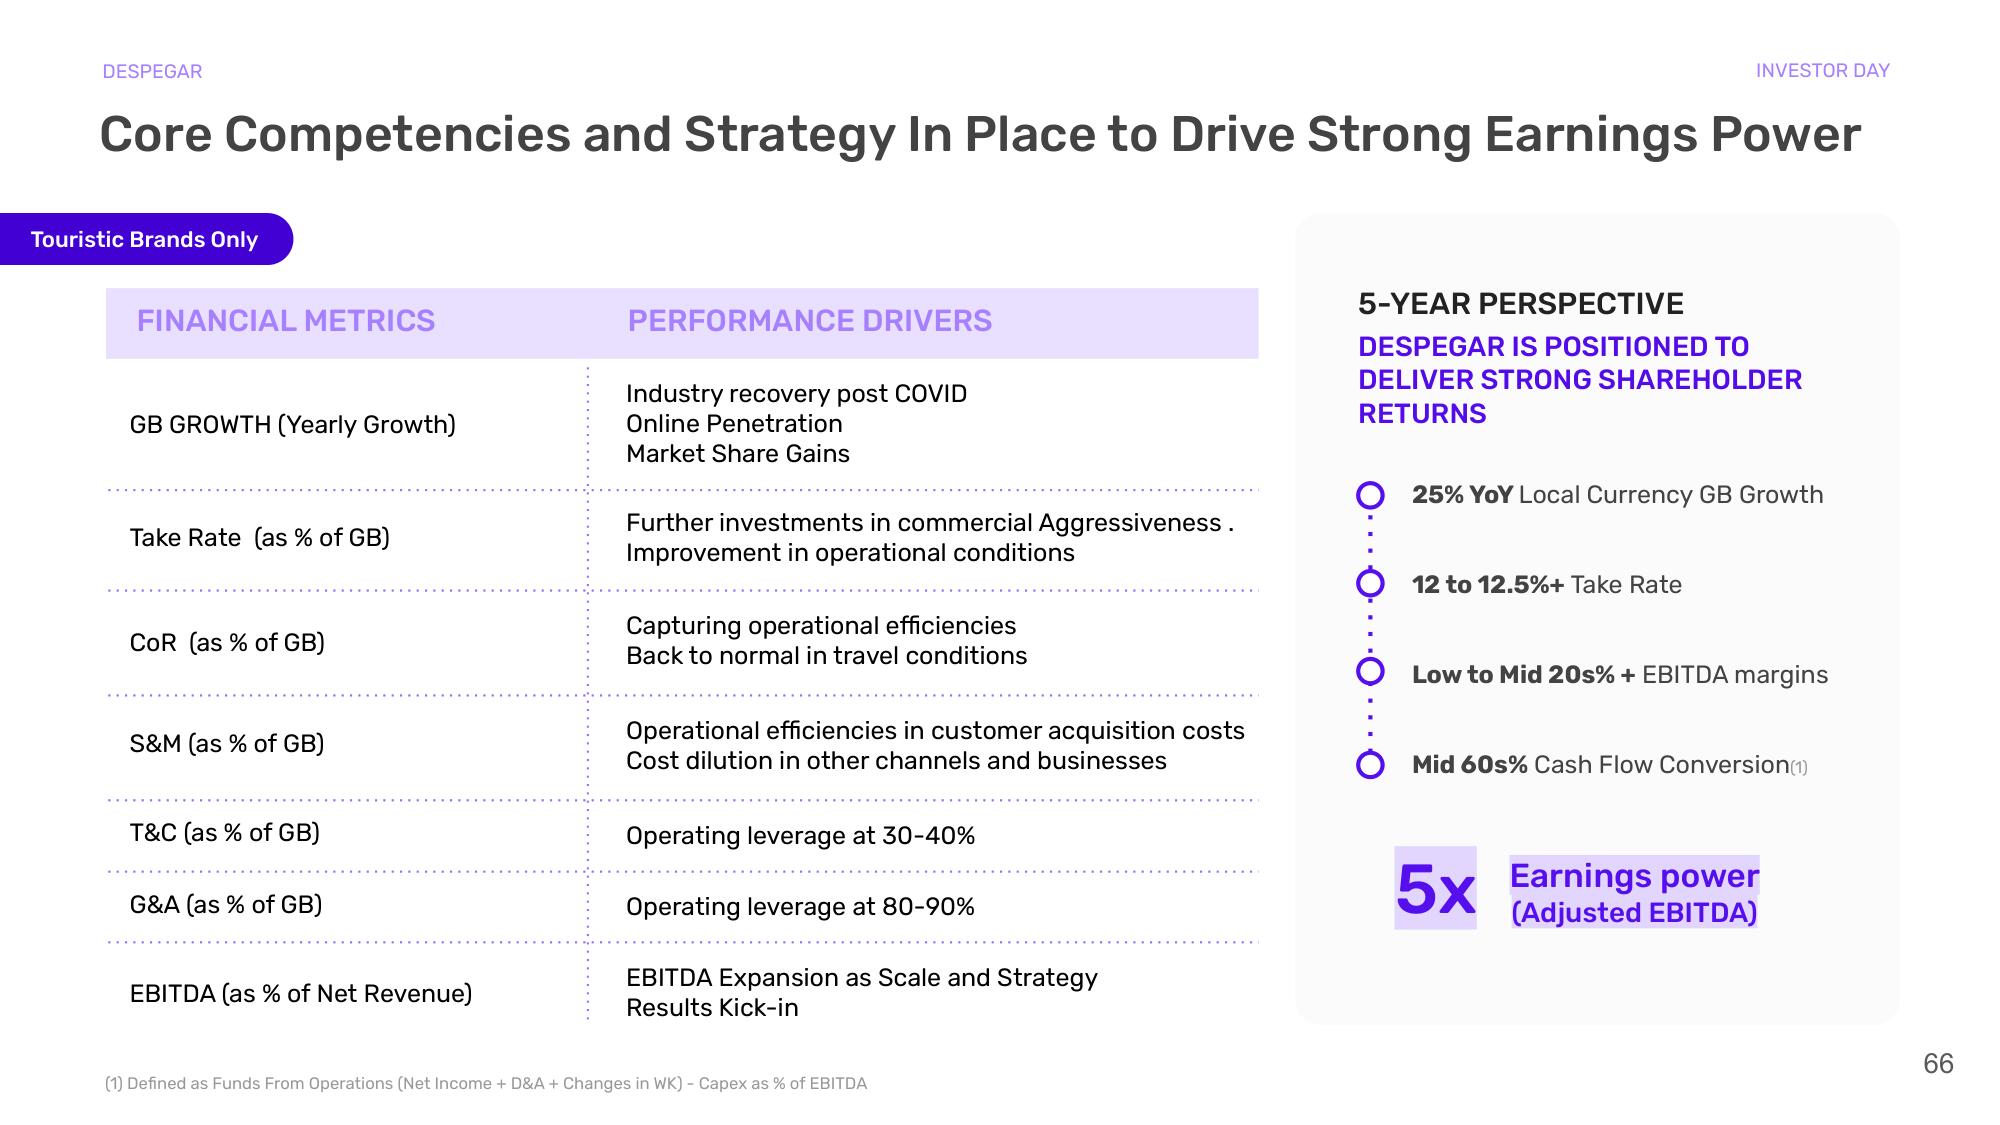
Core Competencies and Strategy In Place to Drive Strong Earnings Power
Touristic Brands Only
FINANCIAL METRICS
GB GROWTH (Yearly Growth)
Take Rate (as % of GB)
COR (as % of GB)
S&M (as % of GB)
T&C (as % of GB)
G&A (as % of GB)
EBITDA (as % of Net Revenue)
PERFORMANCE DRIVERS
Industry recovery post COVID
Online Penetration
Market Share Gains
Further investments in commercial Aggressiveness.
Improvement in operational conditions
Capturing operational efficiencies
Back to normal in travel conditions
Operational efficiencies in customer acquisition costs
Cost dilution in other channels and businesses
Operating leverage at 30-40%
Operating leverage at 80-90%
EBITDA Expansion as Scale and Strategy
Results Kick-in
(1) Defined as Funds From Operations (Net Income + D&A + Changes in WK) - Capex as % of EBITDA
INVESTOR DAY
5-YEAR PERSPECTIVE
DESPEGAR IS POSITIONED TO
DELIVER STRONG SHAREHOLDER
RETURNS
25% YoY Local Currency GB Growth
12 to 12.5%+ Take Rate
Low to Mid 20s% + EBITDA margins
Mid 60s% Cash Flow Conversion (1)
5x Earnings power
(Adjusted EBITDA)
66View entire presentation