Baird Investment Banking Pitch Book
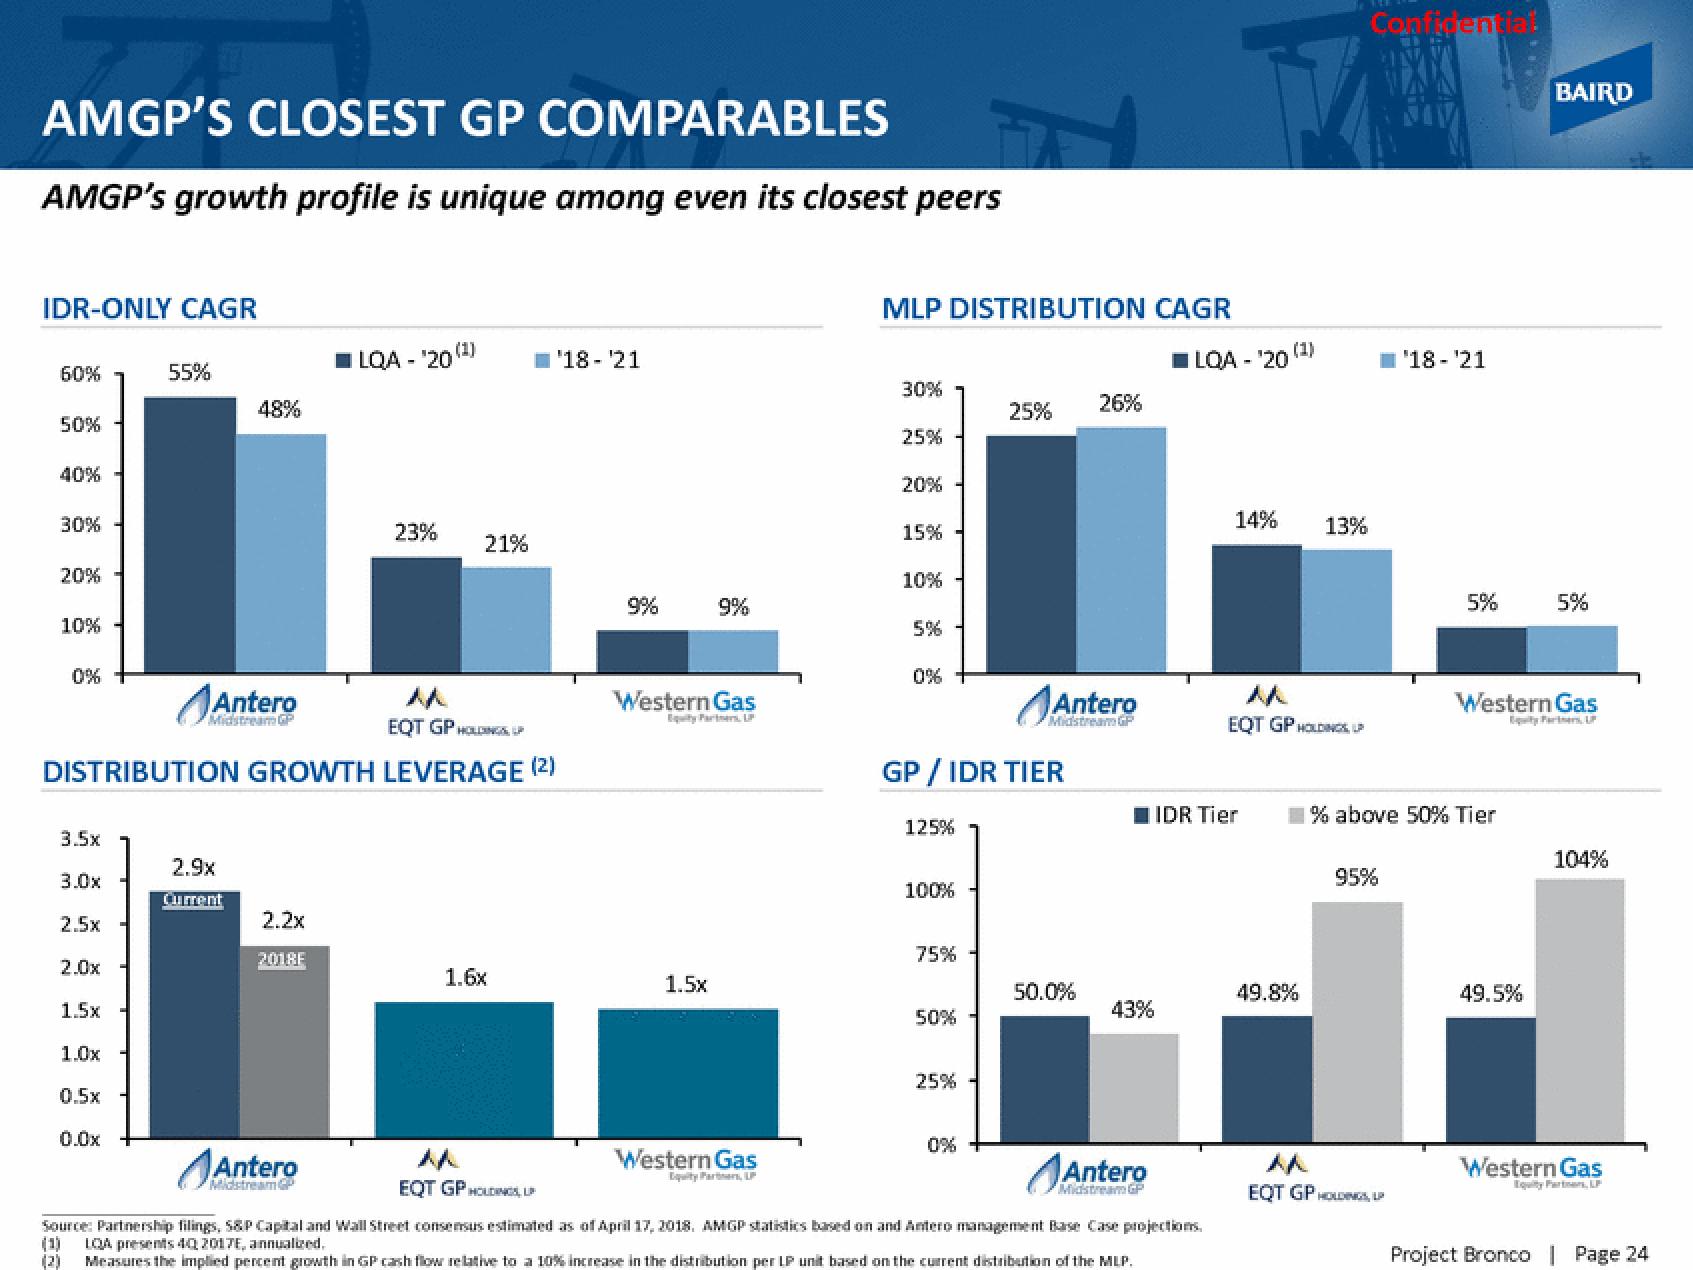
AMGP'S CLOSEST GP COMPARABLES
AMGP's growth profile is unique among even its closest peers
IDR-ONLY CAGR
60%
50%
40%
30%
20%
10%
0%
3.5x
3.0x
2.5x
2.0x
1.5x
55%
1.0x
0.5x
0.0x
48%
EQT GP HOLDINGS, P
DISTRIBUTION GROWTH LEVERAGE (2)
Midstream GP
2.9x
Current
2.2x
2018F
ILQA - '20 (¹)
Antero
Midstream P
23%
21%
'18-21
1.6x
9%
9%
Western Gas
Equity Partners LP
1.5x
Western Gas
Equity Partners LP
MLP DISTRIBUTION CAGR
30%
25%
20%
15%
10%
5%
0%
125%
GP/IDR TIER
100%
75%
50%
25%
25%
0%
Antero
Midstream GP
26%
50.0%
43%
Antero
Midstream GP
■LQA - ¹20 (¹)
14%
EQT GP HOLDINGS UP
Source: Partnership filings, S&P Capital and Wall Street consensus estimated as of April 17, 2018. AMGP statistics based on and Antero management Base Case projections.
(1) LOA presents 4Q 2017E, annualized.
(2)
Measures the implied percent growth in GP cash flow relative to a 10% increase in the distribution per LP unit based on the current distribution of the MLP.
IDR Tier
EQT GP HOLDINGS UP
13%
49.8%
Confidential
95%
'18-'21
^^
EQT GP HOLDINGS UP
5%
% above 50% Tier
Cont
49.5%
BAIRD
Western Gas
tyre, UP
5%
104%
Western Gas
Equity Partners, LP
Project Bronco | Page 24View entire presentation