Credit Suisse Results Presentation Deck
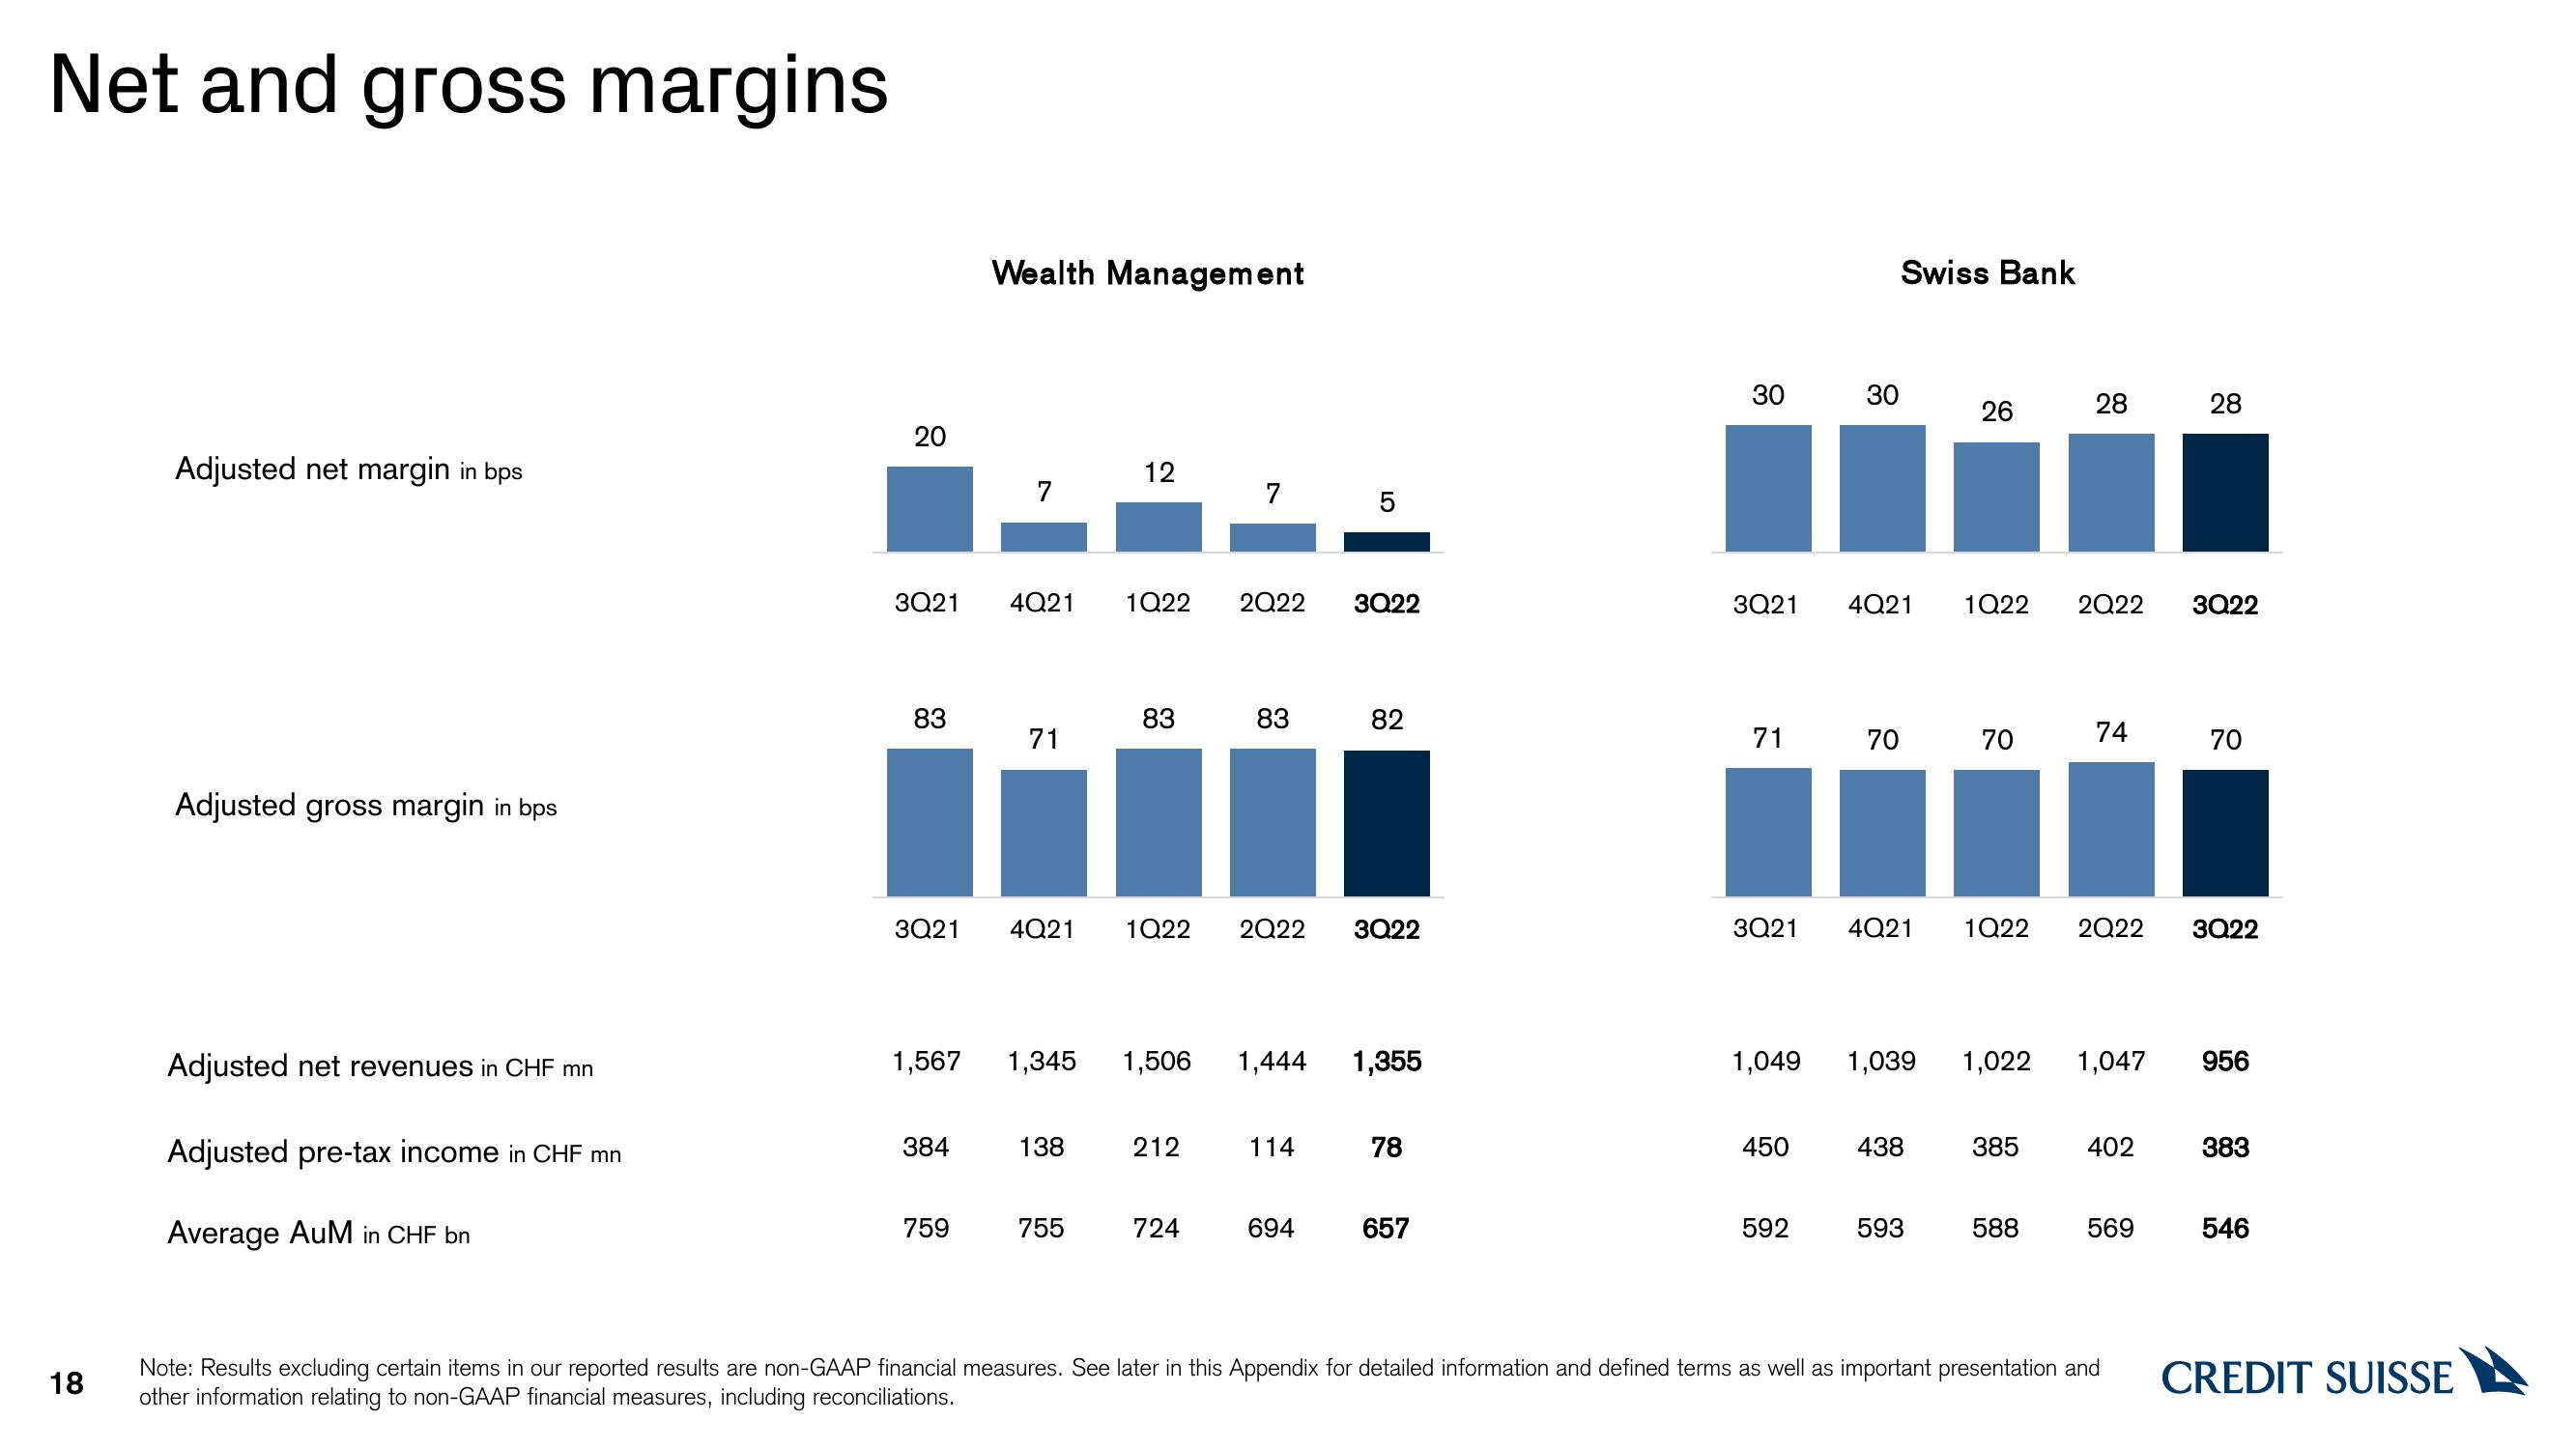
Net and gross margins
18
Adjusted net margin in bps
Adjusted gross margin in bps
Adjusted net revenues in CHF mn
Adjusted pre-tax income in CHF mn
Average AuM in CHF bn
20
83
3Q21 4Q21 1Q22
Wealth Management
384
71
759
12
138
83
755
1,567 1,345 1,506 1,444
7
3Q21 4Q21 1Q22 2Q22 3Q22
212
2Q22
724
83
114
5
694
3Q22
82
1,355
78
657
30
3Q21
71
3Q21
450
30
592
Swiss Bank
4Q21
70
4Q21
438
26
593
1Q22
70
1,049 1,039 1,022 1,047
28
385
1Q22 2Q22
588
2Q22 3Q22
74
402
569
28
Note: Results excluding certain items in our reported results are non-GAAP financial measures. See later in this Appendix for detailed information and defined terms as well as important presentation and
other information relating to non-GAAP financial measures, including reconciliations.
70
3Q22
956
383
546
CREDIT SUISSEView entire presentation