HHR Investor Presentation Deck
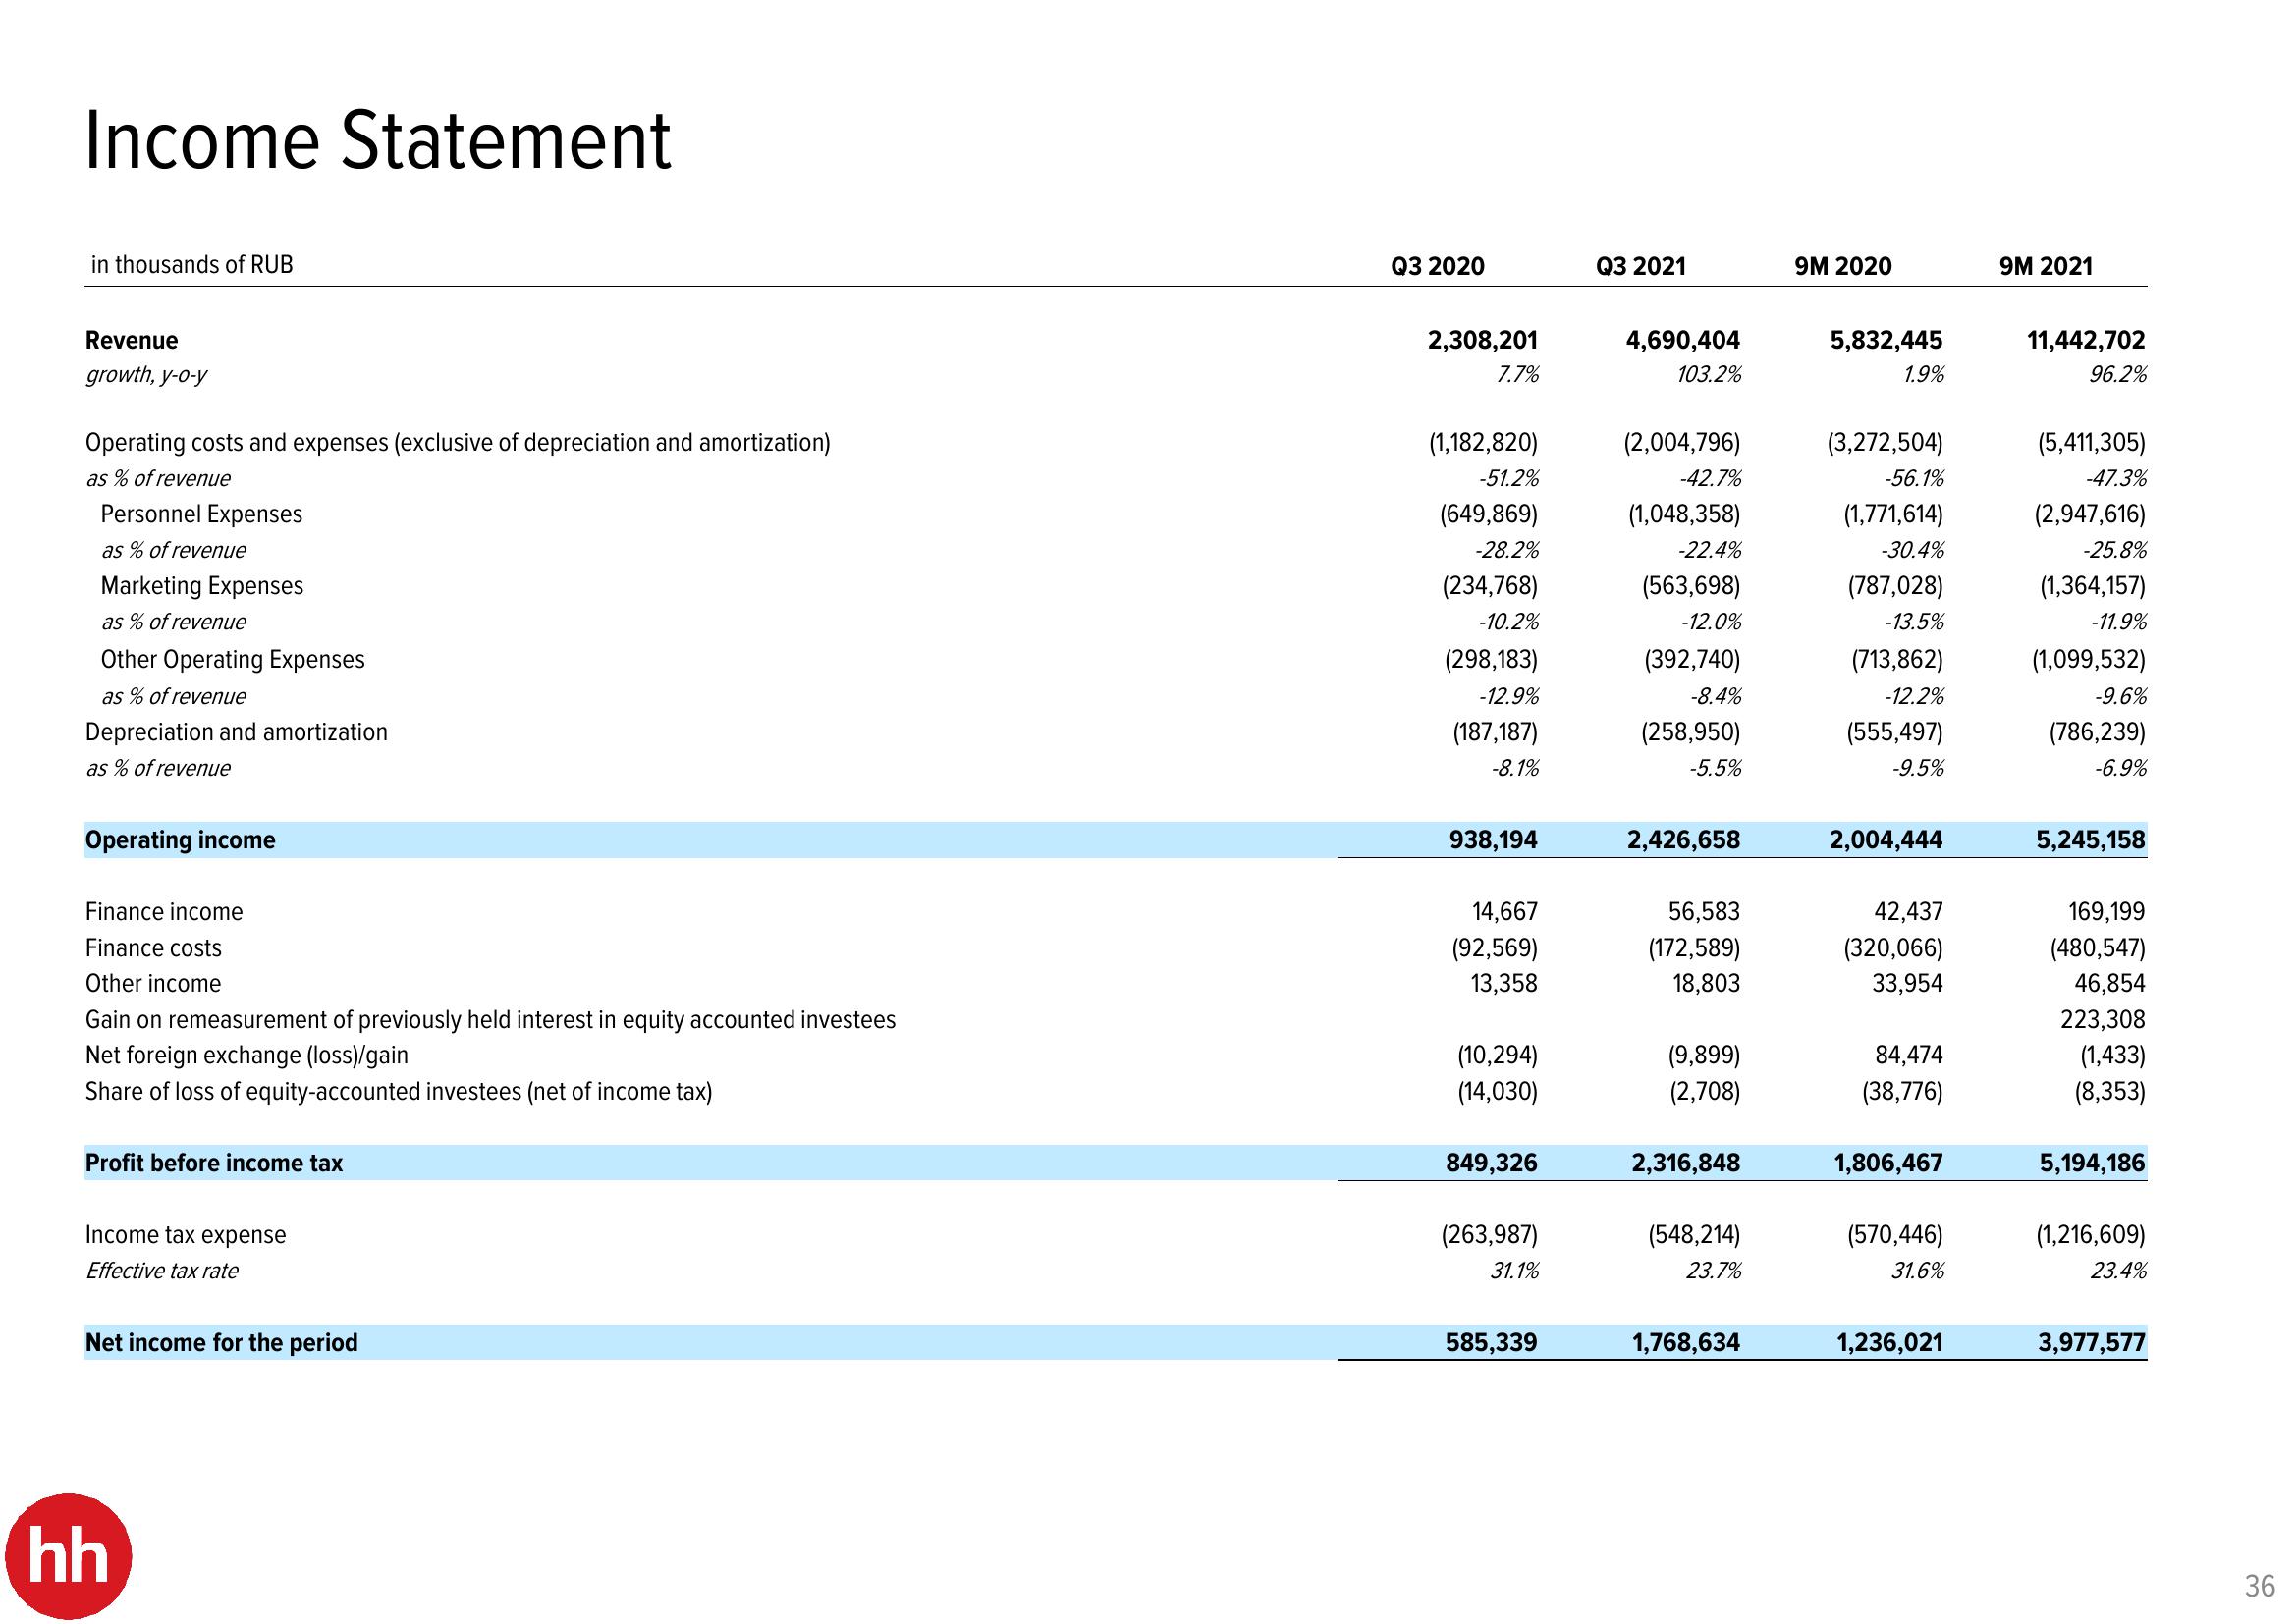
Income Statement
in thousands of RUB
Revenue
growth, y-o-y
Operating costs and expenses (exclusive of depreciation and amortization)
as% of revenue
Personnel Expenses
as % of revenue
Marketing Expenses
as % of revenue
Other Operating Expenses
as % of revenue
Depreciation and amortization
as % of revenue
Operating income
Finance income
Finance costs
Other income
Gain on remeasurement of previously held interest in equity accounted investees
Net foreign exchange (loss)/gain
Share of loss of equity-accounted investees (net of income tax)
Profit before income tax
Income tax expense
Effective tax rate
Net income for the period
hh
Q3 2020
2,308,201
7.7%
(1,182,820)
-51.2%
(649,869)
-28.2%
(234,768)
-10.2%
(298,183)
-12.9%
(187,187)
-8.1%
938,194
14,667
(92,569)
13,358
(10,294)
(14,030)
849,326
(263,987)
31.1%
585,339
Q3 2021
4,690,404
103.2%
(2,004,796)
-42.7%
(1,048,358)
-22.4%
(563,698)
-12.0%
(392,740)
-8.4%
(258,950)
-5.5%
2,426,658
56,583
(172,589)
18,803
(9,899)
(2,708)
2,316,848
(548,214)
23.7%
1,768,634
9M 2020
5,832,445
1.9%
(3,272,504)
-56.1%
(1,771,614)
-30.4%
(787,028)
-13.5%
(713,862)
-12.2%
(555,497)
-9.5%
2,004,444
42,437
(320,066)
33,954
84,474
(38,776)
1,806,467
(570,446)
31.6%
1,236,021
9M 2021
11,442,702
96.2%
(5,411,305)
-47.3%
(2,947,616)
-25.8%
(1,364,157)
-11.9%
(1,099,532)
-9.6%
(786,239)
-6.9%
5,245,158
169,199
(480,547)
46,854
223,308
(1,433)
(8,353)
5,194,186
(1,216,609)
23.4%
3,977,577
36View entire presentation