Solar 101
Installed Solar Capacity (MWdc)
130,000
120,000
110,000
100,000
90,000
80,000
70,000
60,000
50,000
40,000
30,000
20,000
10,000
Massive Growth Since 2000 Sets
the Stage for the Solar+ Decade
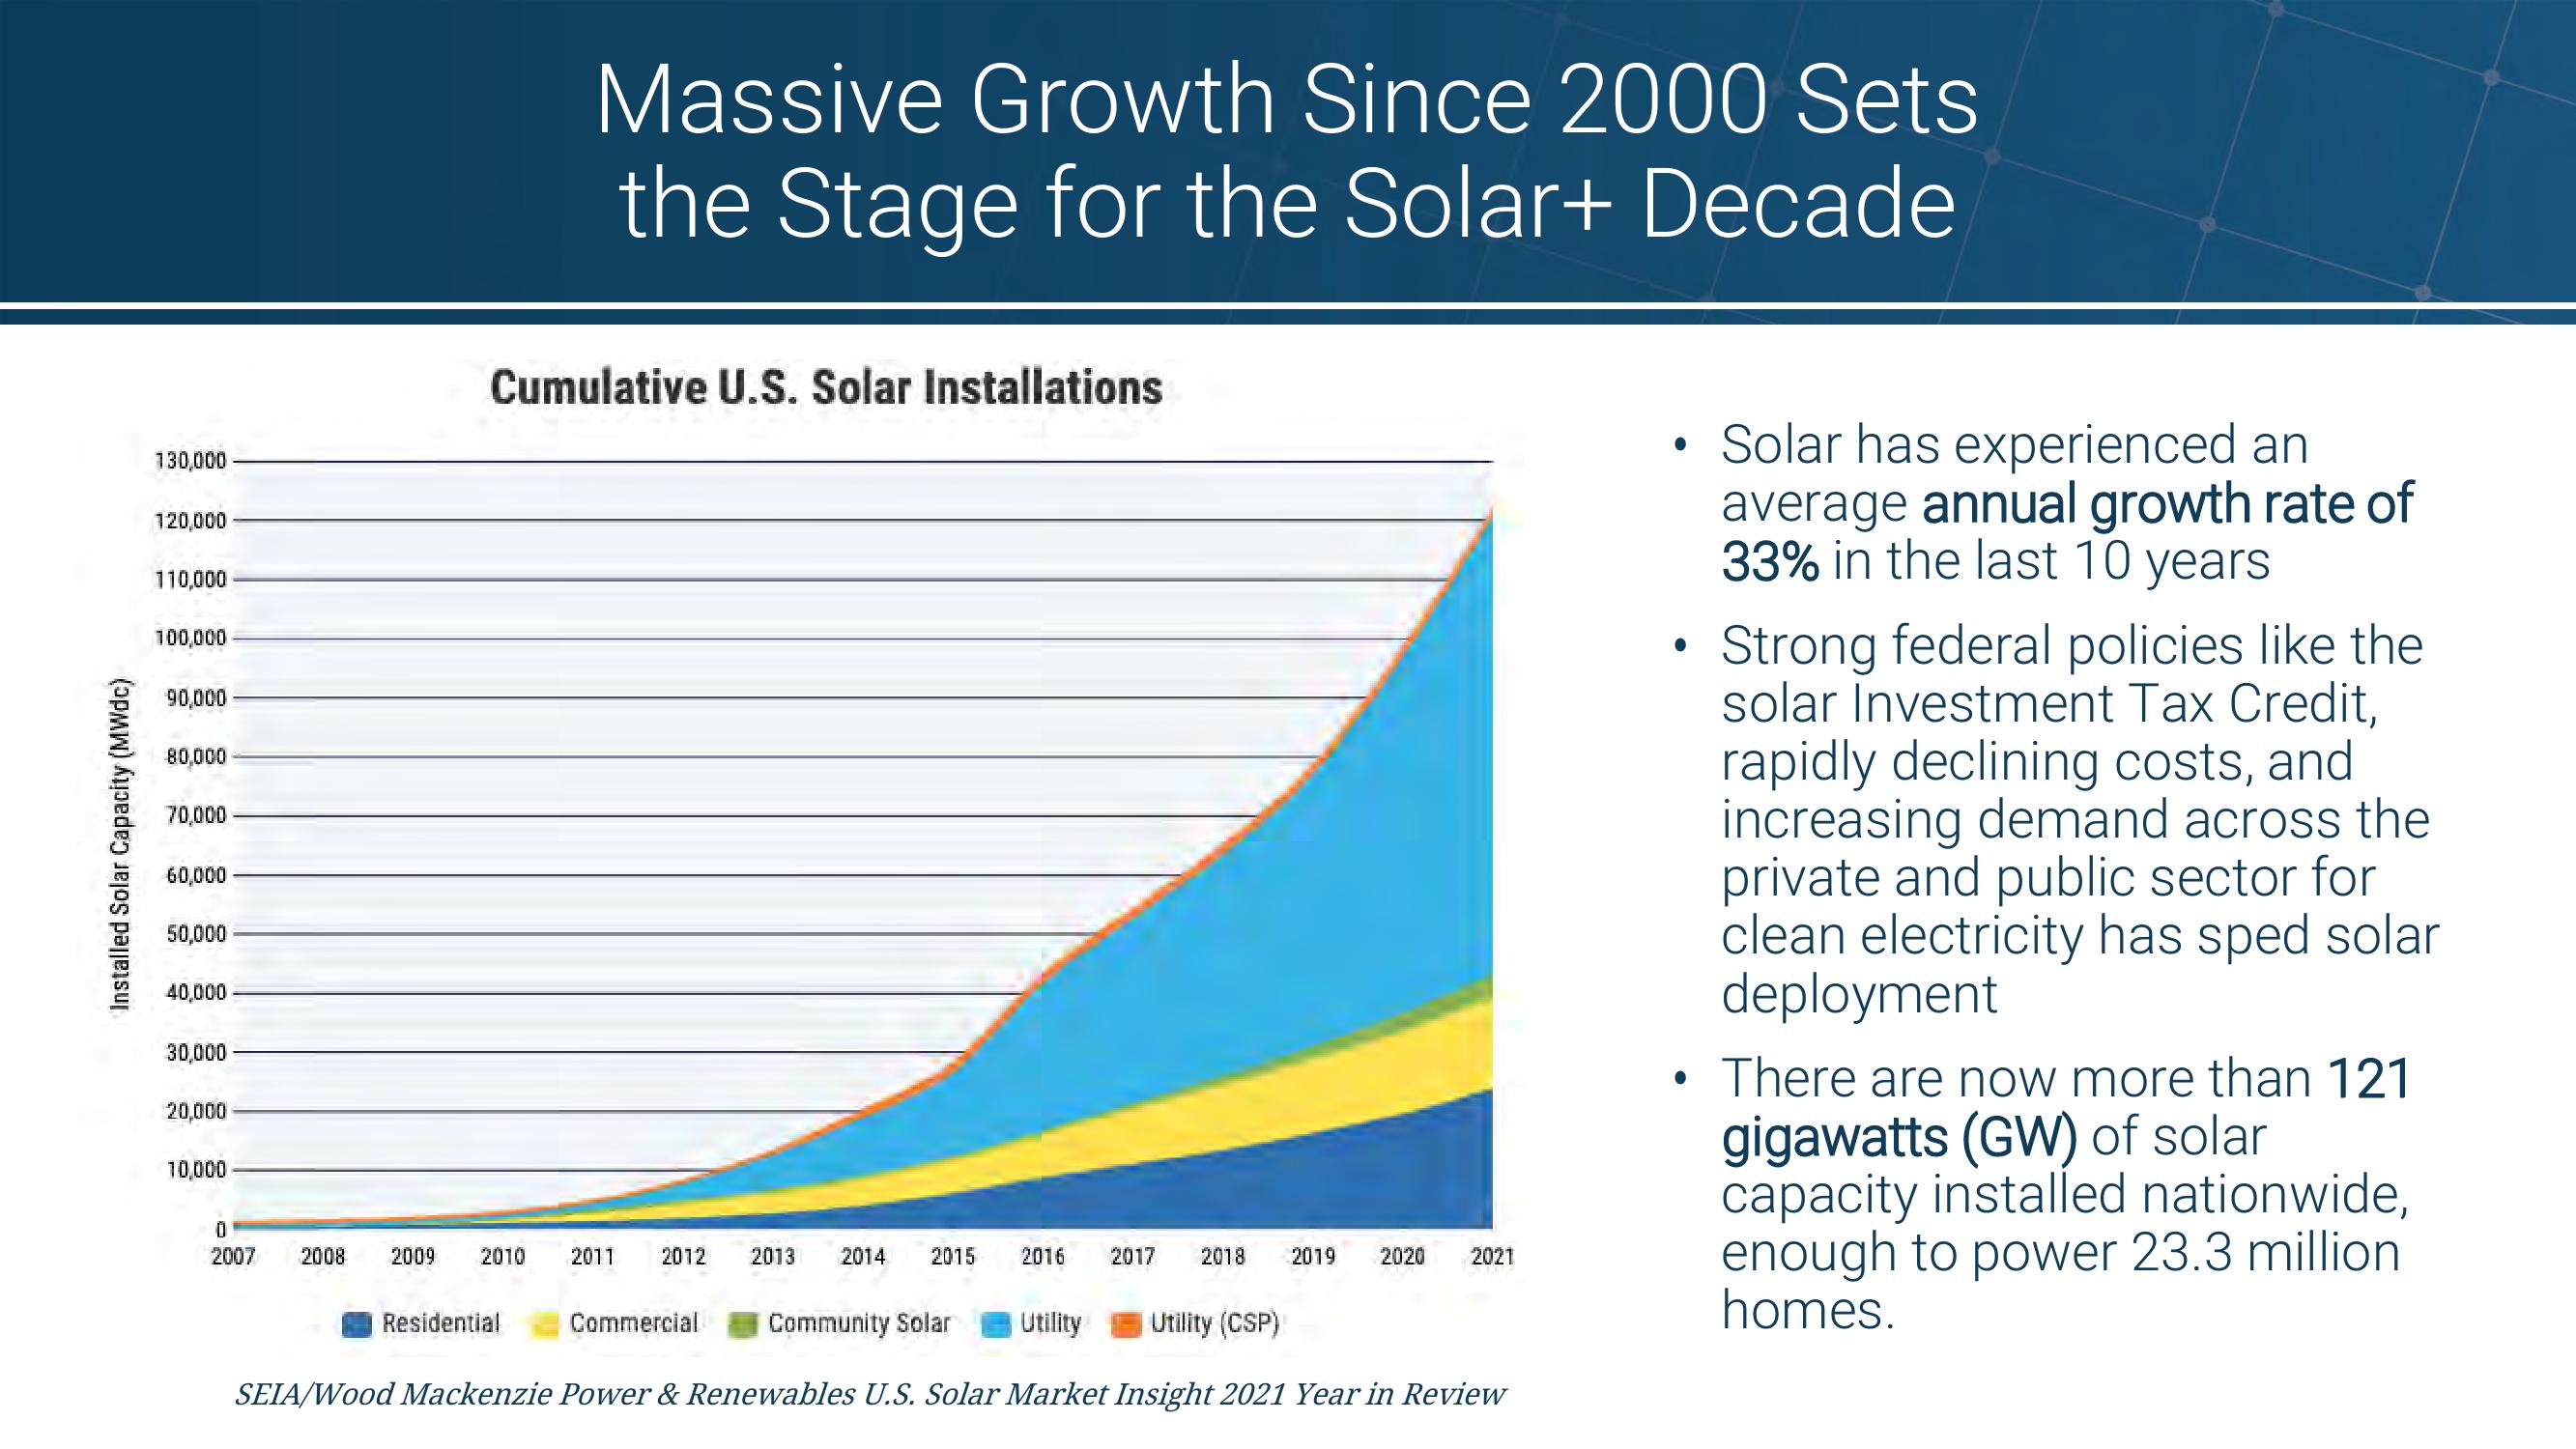
Cumulative U.S. Solar Installations
0
2007
2008 2009 2010 2011
2012 2013 2014
2015
2016
2017 2018 2019
2020
2021
Residential
Commercial
Community Solar
Utility
Utility (CSP)
SEIA/Wood Mackenzie Power & Renewables U.S. Solar Market Insight 2021 Year in Review
•
·
.
Solar has experienced an
average annual growth rate of
33% in the last 10 years
Strong federal policies like the
solar Investment Tax Credit,
rapidly declining costs, and
increasing demand across the
private and public sector for
clean electricity has sped solar
deployment
There are now more than 121
gigawatts (GW) of solar
capacity installed nationwide,
enough to power 23.3 million
homes.View entire presentation