Allego Results Presentation Deck
Increasing Demand and
Elevated Visibility
Total Number of Charging Sessions
9.2
(in mm)
3.0
2019
+~200%
3.7
2020
2020
80%
User Track Record on Allego's Network²
(in % recurring users)
82%
6.1
2021
2021
Allego>
2022
2.1
2022
+~33%
1Q22
80%
79%
IIIII
2.6
1Q22
1Q23
81%
1Q23
Source: Company information.
1.
Total number of charging sessions for both company-owned and third-party sites
2.
All customer data is tracked through the ID cards/tokens used on Allego's network and required for invoicing
01
02
Charging Sessions Increasing with
Higher Density of EVs
●
Development of Smart Charging Capacity
provides opportunities for ancillary services
●
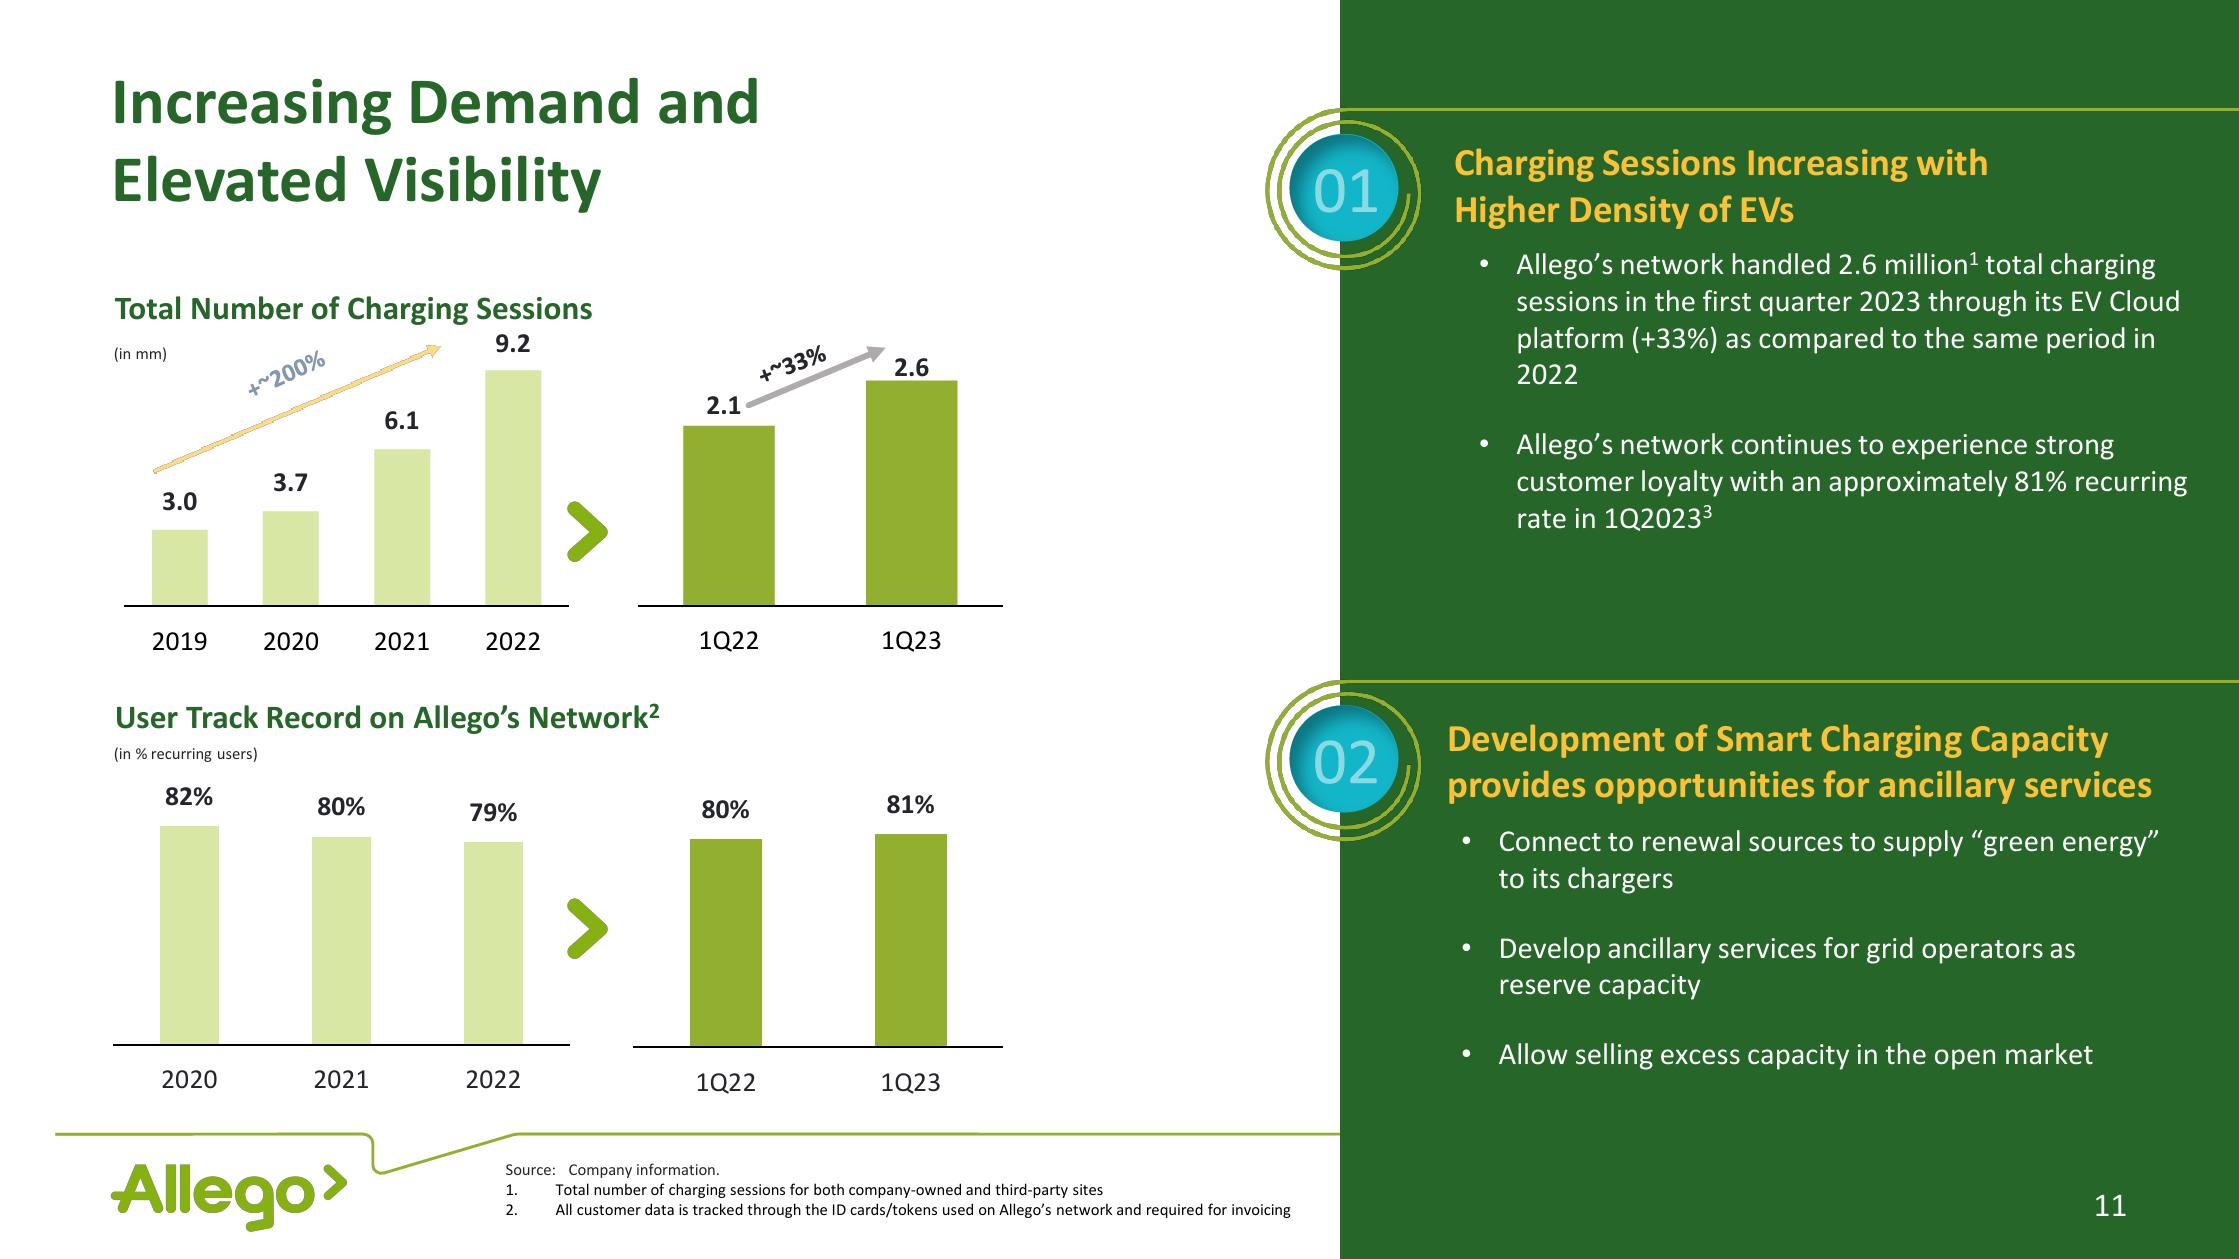
Allego's network handled 2.6 million¹ total charging
sessions in the first quarter 2023 through its EV Cloud
platform (+33%) as compared to the same period in
2022
●
Allego's network continues to experience strong
customer loyalty with an approximately 81% recurring
rate in 102023³
Connect to renewal sources to supply "green energy"
to its chargers
Develop ancillary services for grid operators as
reserve capacity
Allow selling excess capacity in the open market
11View entire presentation