Engine No. 1 Activist Presentation Deck
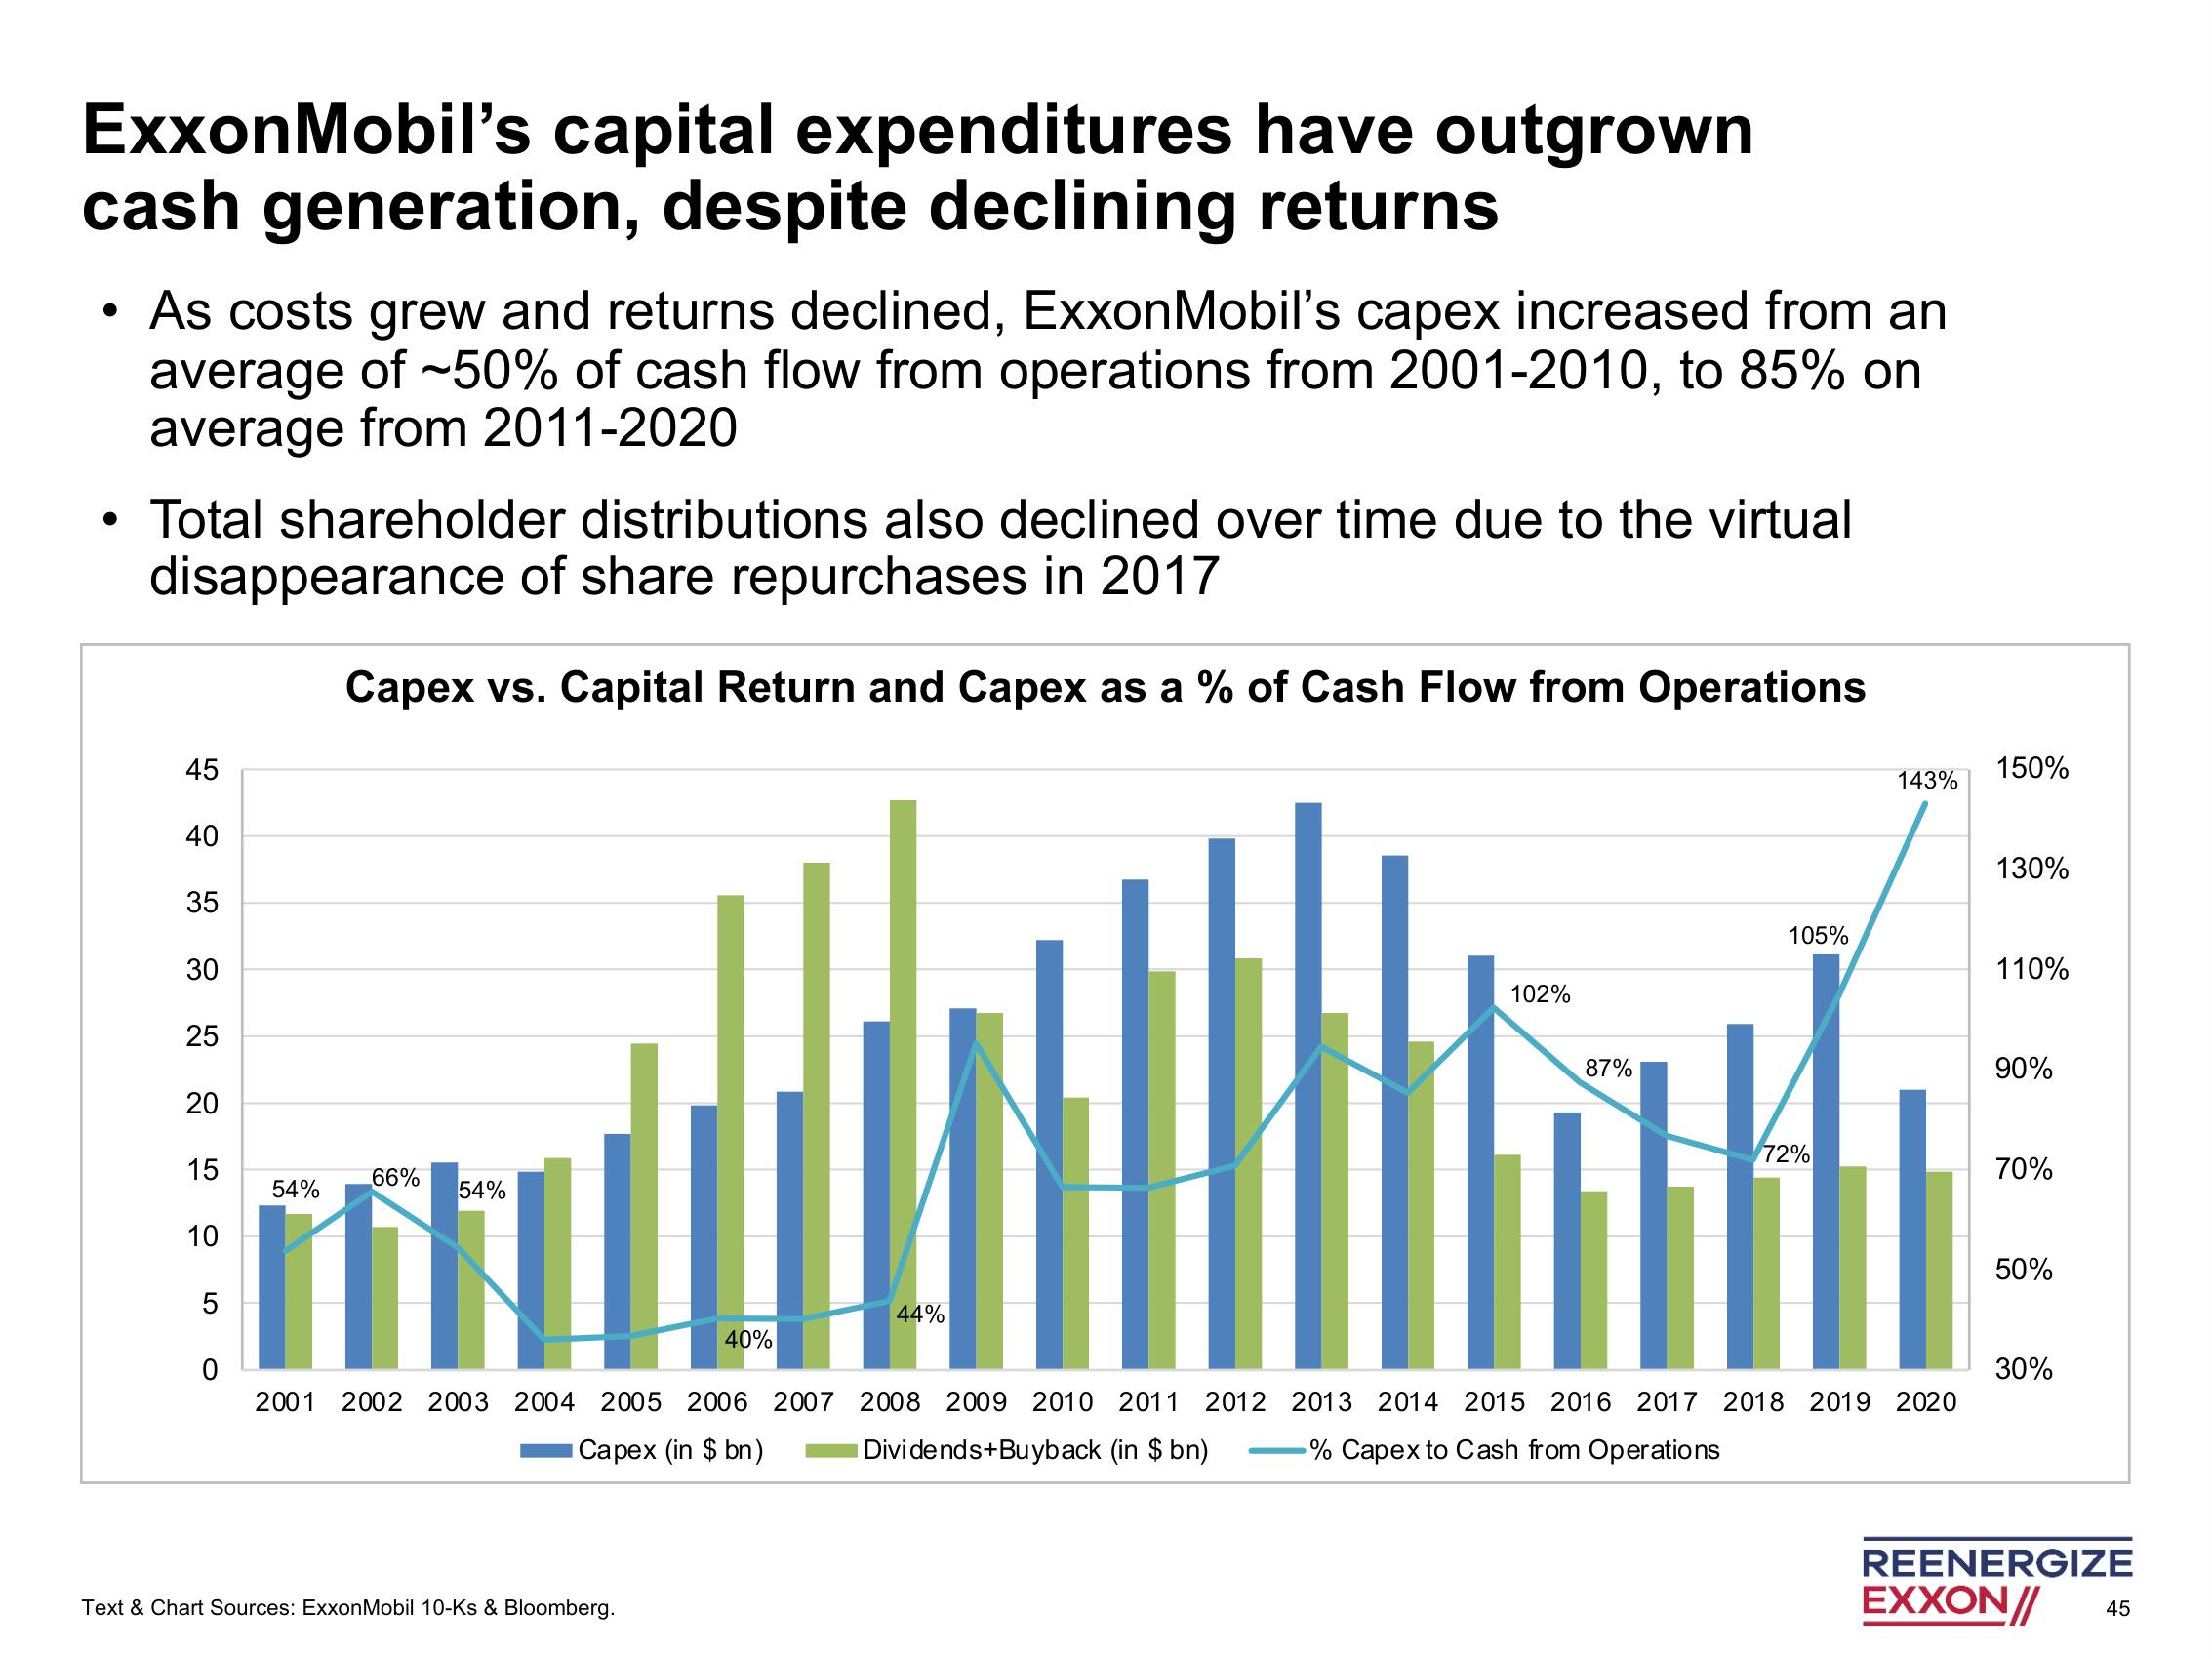
ExxonMobil's capital expenditures have outgrown
cash generation, despite declining returns
• As costs grew and returns declined, ExxonMobil's capex increased from an
average of ~50% of cash flow from operations from 2001-2010, to 85% on
average from 2011-2020
●
• Total shareholder distributions also declined over time due to the virtual
disappearance of share repurchases in 2017
Capex vs. Capital Return and Capex as a % of Cash Flow from Operations
45
40
35
30
25
20
15
10
5
0
54%
66%
54%
40%
Text & Chart Sources: ExxonMobil 10-Ks & Bloomberg.
44%
2001 2002 2003 2004 2005 2006 2007 2008 2009 2010 2011 2012
Dividends+Buyback (in $bn)
Capex (in $bn)
102%
87%
105%
72%
143%
2013 2014 2015 2016 2017 2018 2019 2020
% Capex to Cash from Operations
150%
130%
110%
90%
70%
50%
30%
REENERGIZE
EXXON//
45View entire presentation