ASML Reports €3.3 Billion Net Sales at 48.2% Gross Margin in Q2
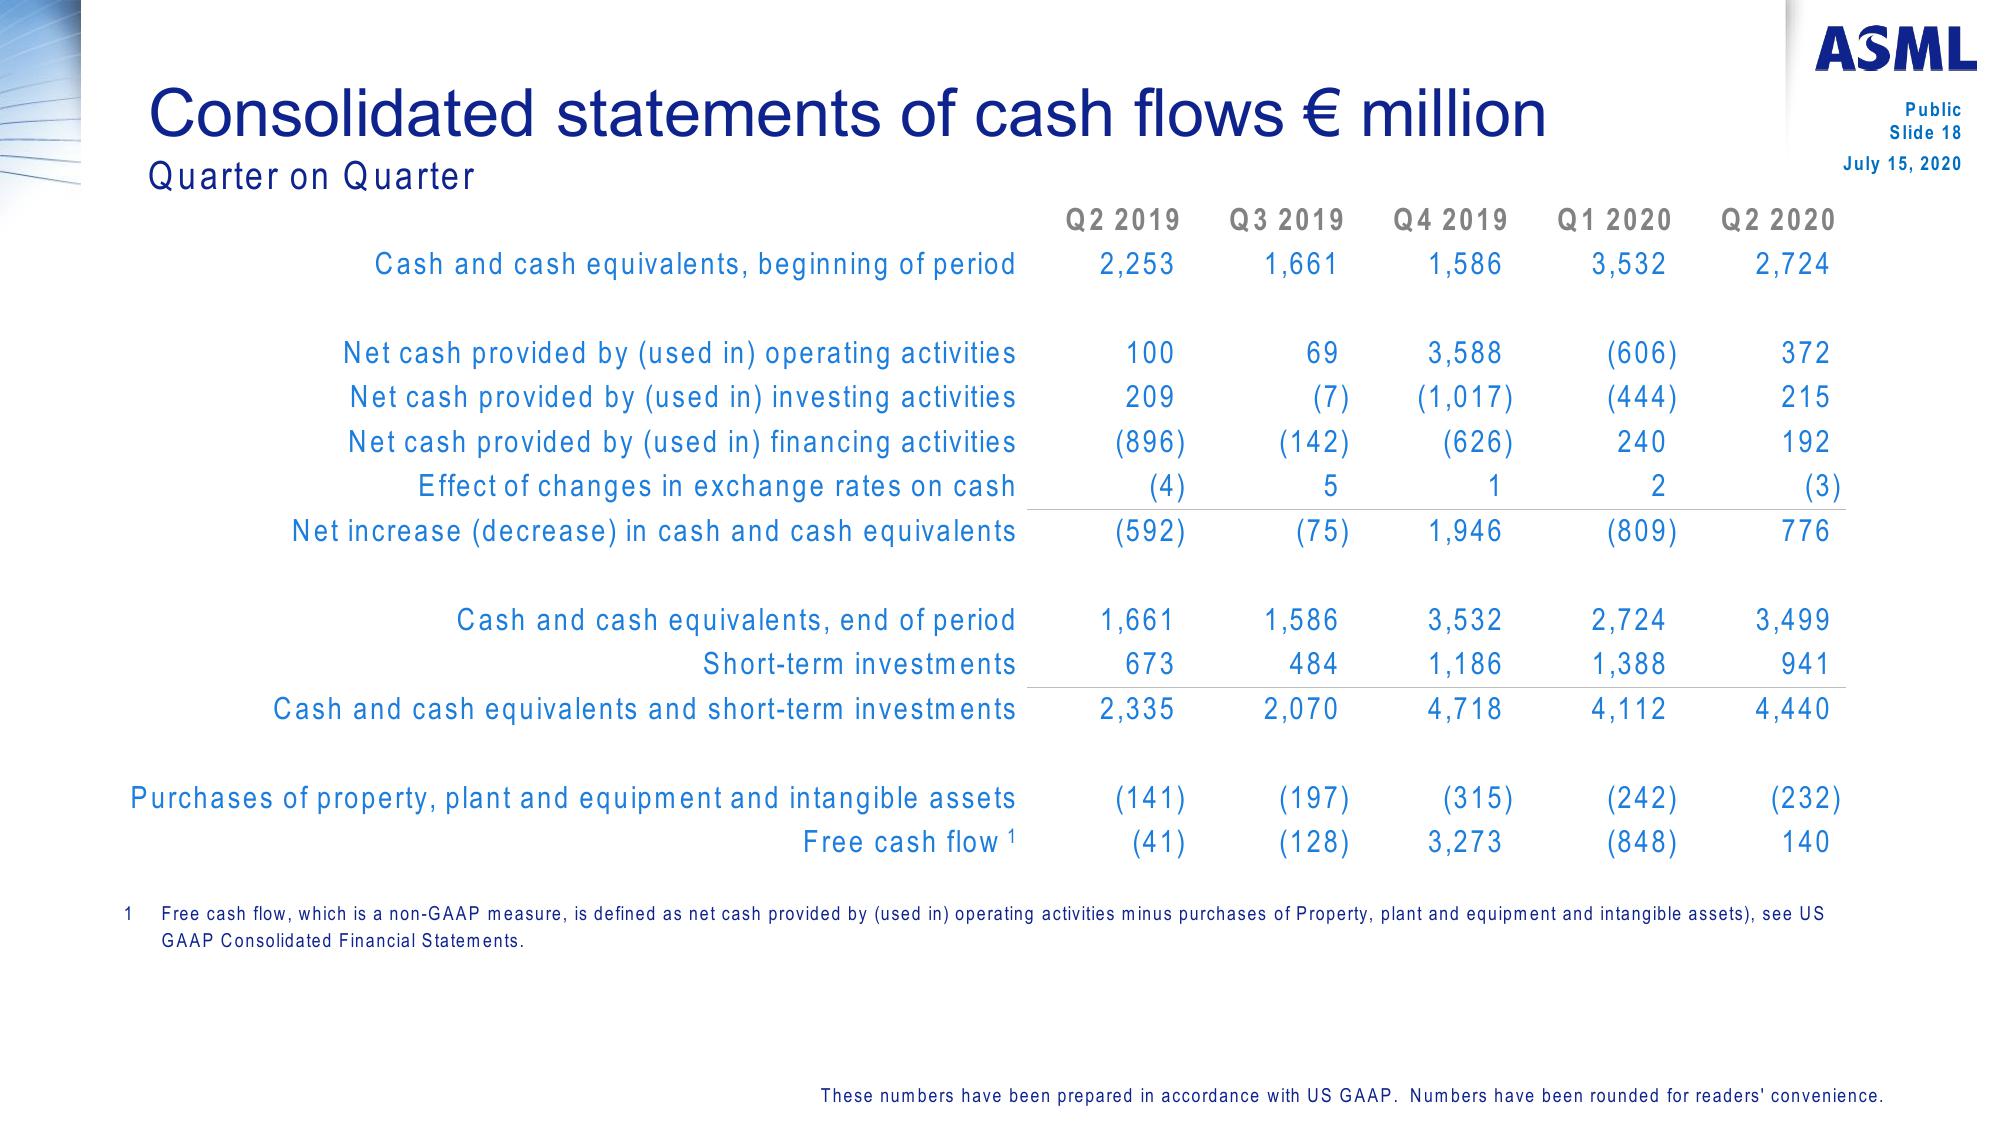
Consolidated statements of cash flows € million
Quarter on Quarter
1
Cash and cash equivalents, beginning of period
Net cash provided by (used in) operating activities
Net cash provided by (used in) investing activities
Net cash provided by (used in) financing activities
Effect of changes in exchange rates on cash
Net increase (decrease) in cash and cash equivalents
Cash and cash equivalents, end of period
Short-term investments
Cash and cash equivalents and short-term investments
Purchases of property, plant and equipment and intangible assets
Free cash flow 1
Q2 2019 Q3 2019
2,253 1,661
100
209
(896)
(4)
(592)
1,661
673
2,335
(141)
(41)
69
(7)
(142)
5
(75)
1,586
484
2,070
Q4 2019 Q1 2020
1,586 3,532
3,588
(1,017)
(626)
1,946
3,532
1,186
4,718
(197)
(315)
(128) 3,273
(606)
(444)
240
2
(809)
2,724
1,388
4,112
(242)
(848)
ASML
Q2 2020
2,724
372
215
192
(3)
776
3,499
941
4,440
Public
Slide 18
July 15, 2020
(232)
140
Free cash flow, which is a non-GAAP measure, is defined as net cash provided by (used in) operating activities minus purchases of Property, plant and equipment and intangible assets), see US
GAAP Consolidated Financial Statements.
These numbers have been prepared in accordance with US GAAP. Numbers have been rounded for readers' convenience.View entire presentation