Presto SPAC Presentation Deck
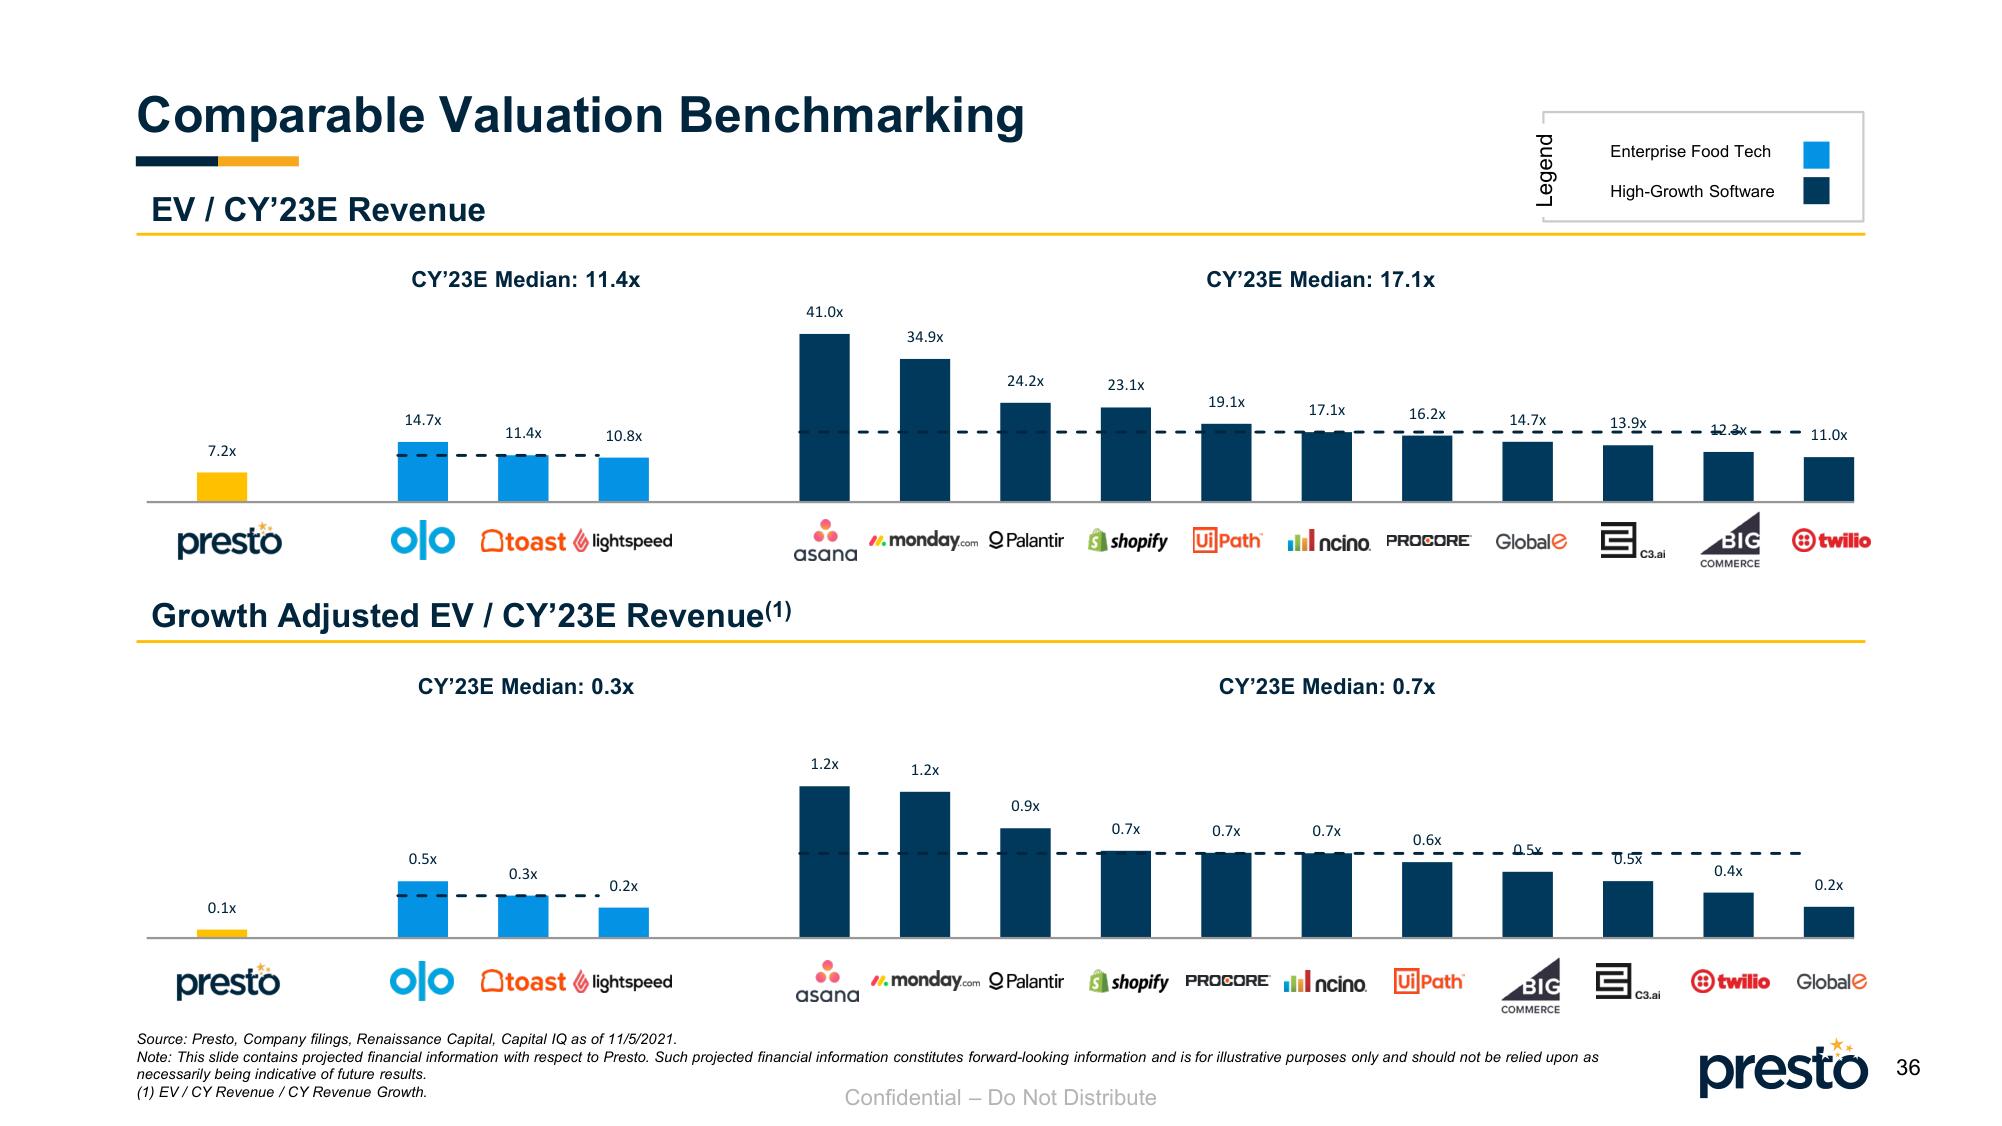
Comparable Valuation Benchmarking
EV/CY'23E Revenue
7.2x
CY'23E Median: 11.4x
0.1x
14.7x
11.4x
presto
olo toast lightspeed
Growth Adjusted EV / CY'23E Revenue(1)
0.5x
10.8x
CY'23E Median: 0.3x
0.3x
0.2x
41.0x
asana
1.2x
34.9x
asana
24,2x
.monday.com Palantir
1.2x
0.9x
23.1x
#monday.com Q Palantir
CY'23E Median: 17.1x
0.7x
19.1x
17.1x
shopify Ui Path incino. PROCORE
0.7x
16.2x
CY'23E Median: 0.7x
0.7x
0.6x
Legend
shopify PROCORE incino. Ui Path
14.7x
Globale
presto
olo Otoast lightspeed
Source: Presto, Company filings, Renaissance Capital, Capital IQ as of 11/5/2021.
Note: This slide contains projected financial information with respect to Presto. Such projected financial information constitutes forward-looking information and is for illustrative purposes only and should not be relied upon as
necessarily being indicative of future results.
(1) EV/CY Revenue / CY Revenue Growth.
Confidential - Do Not Distribute
0.5x
BIG
COMMERCE
Enterprise Food Tech
High-Growth Software
13.9x
C3.ai
-- U.5x
3.
C3.ai
12.3x-
BIG
COMMERCE
0.4x
twilio
11.0x
twilio
0.2x
Global
presto
36View entire presentation