Wix Investor Presentation Deck
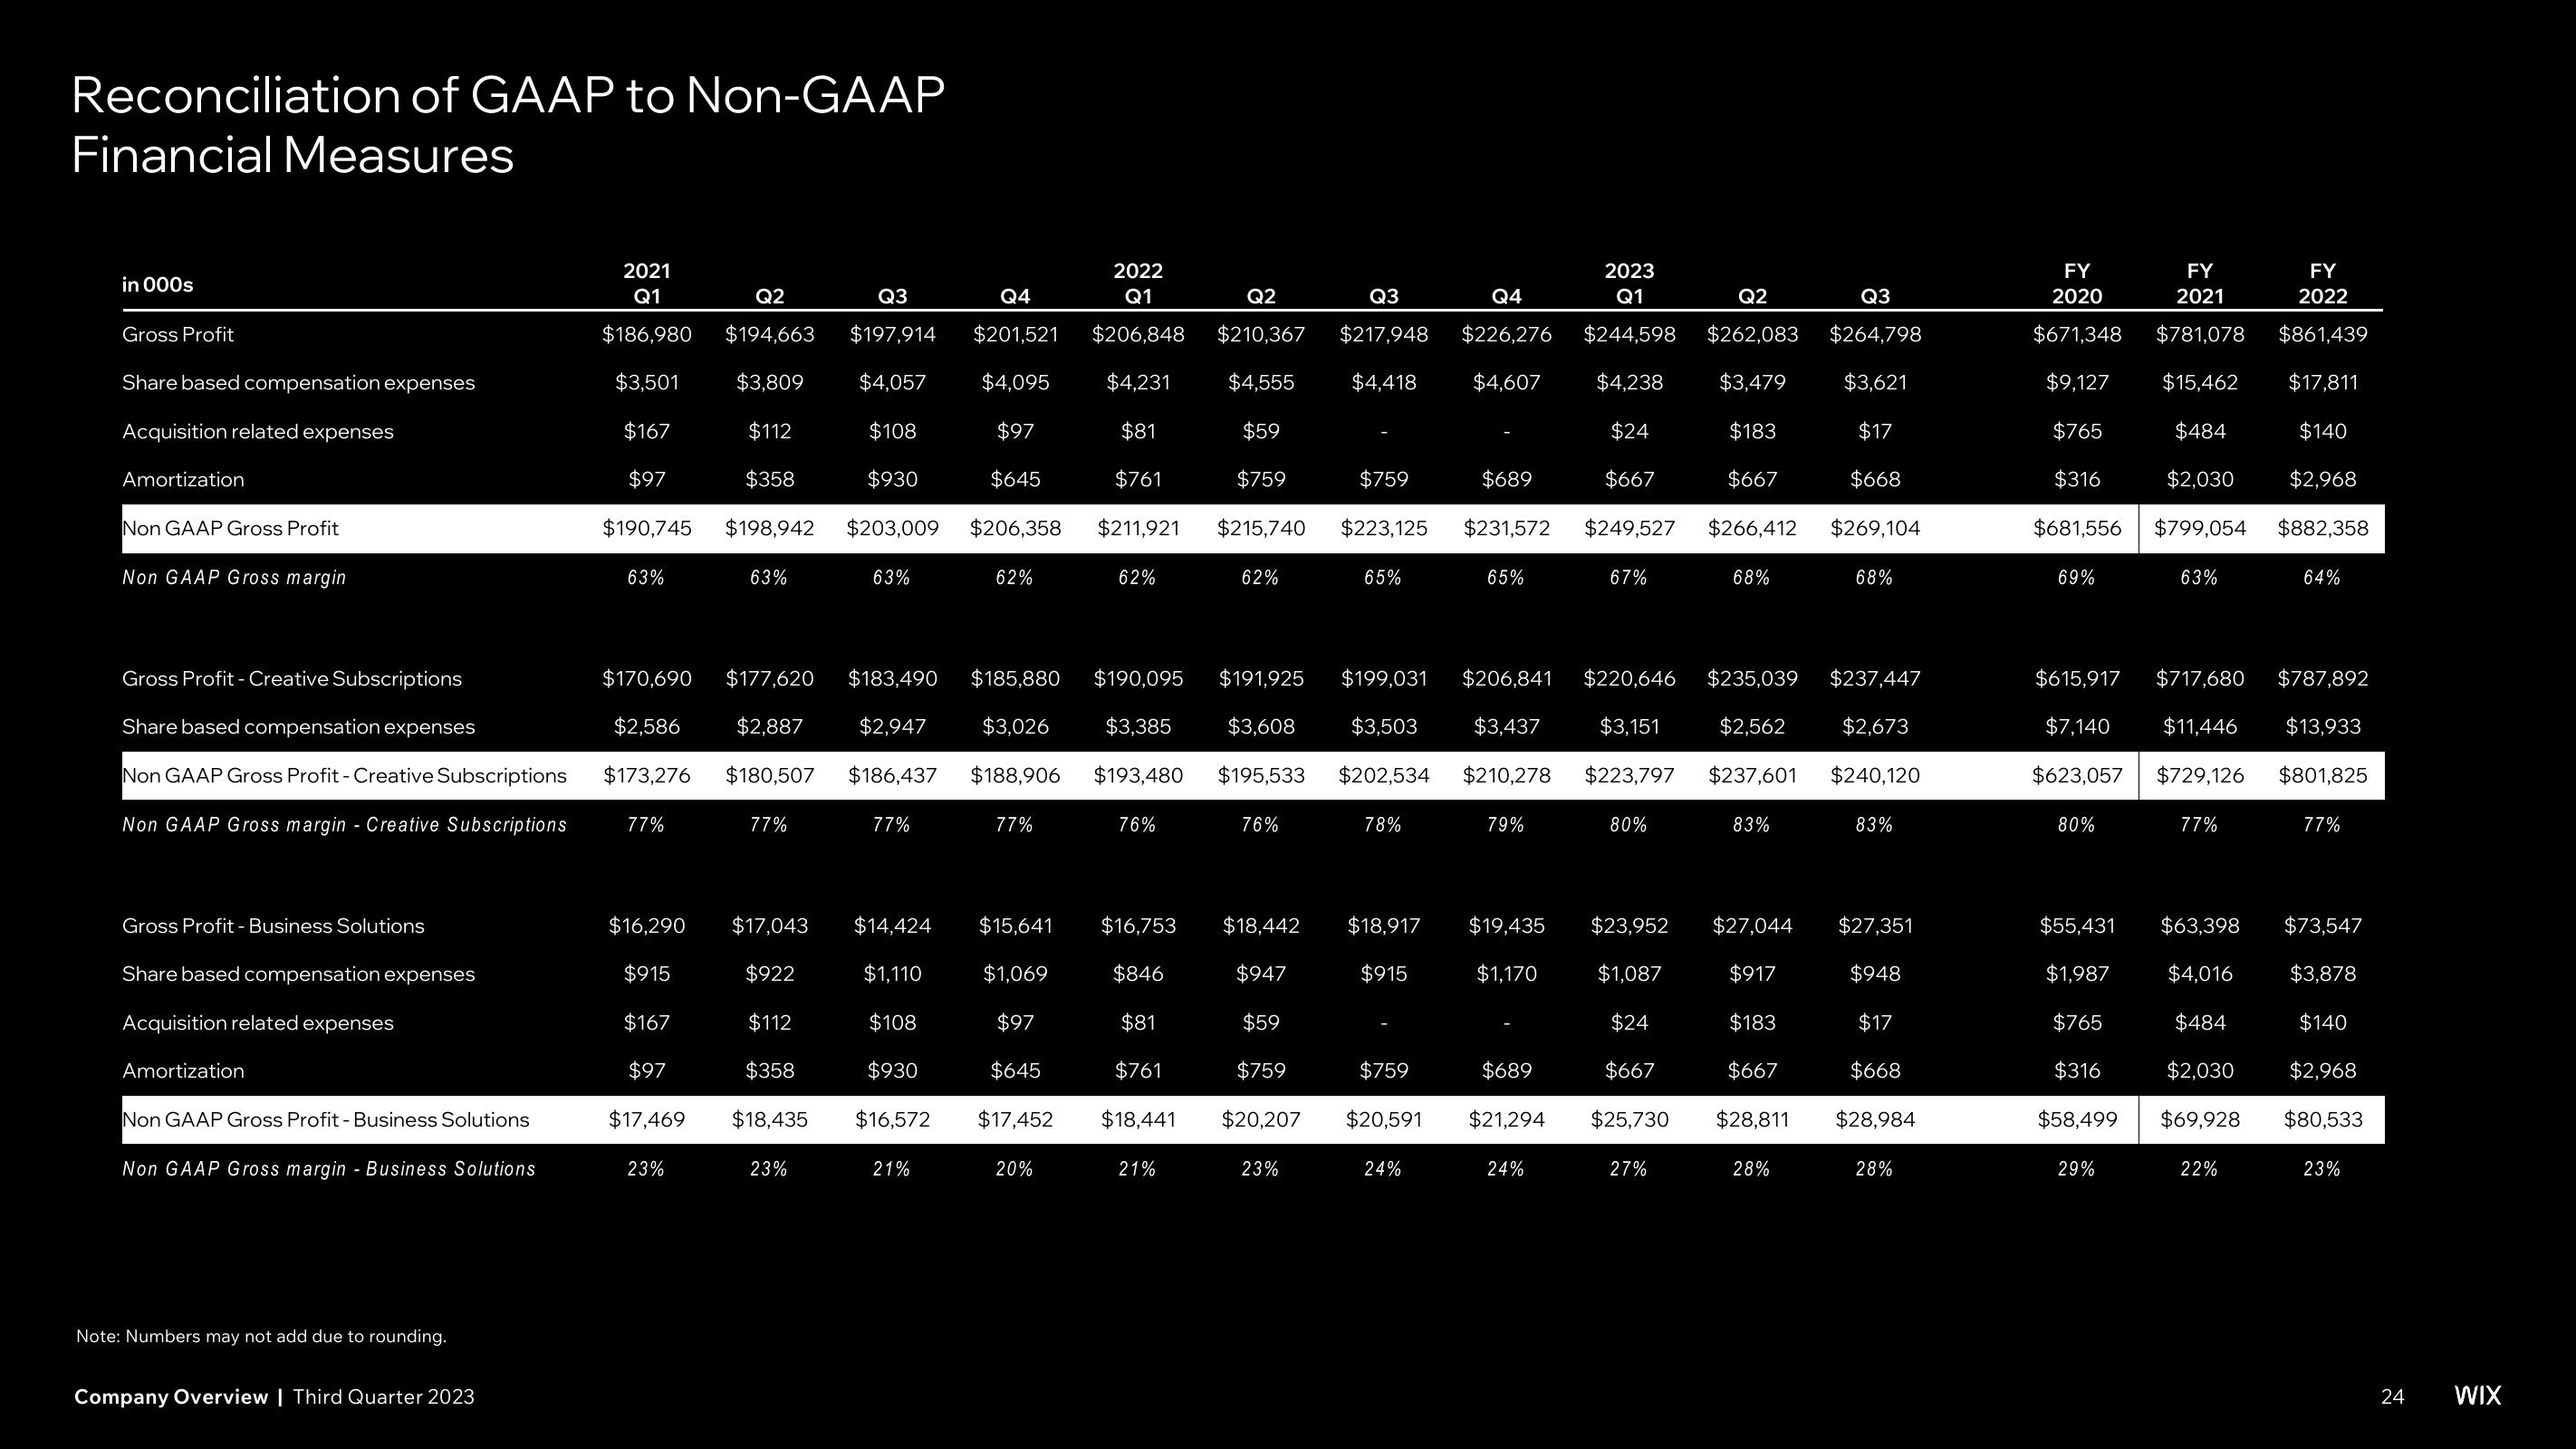
Reconciliation of GAAP to Non-GAAP
Financial Measures
in 000s
Gross Profit
Share based compensation expenses
Acquisition related expenses
Amortization
Non GAAP Gross Profit
Non GAAP Gross margin
Gross Profit - Business Solutions
Gross Profit - Creative Subscriptions
$170,690
Share based compensation expenses
$2,586
Non GAAP Gross Profit - Creative Subscriptions $173,276
Non GAAP Gross margin - Creative Subscriptions
Share based compensation expenses
Acquisition related expenses
Amortization
Non GAAP Gross Profit - Business Solutions
Non GAAP Gross margin - Business Solutions
Note: Numbers may not add due to rounding.
2021
Q1
$186,980
$3,501
$167
$97
$190,745
Company Overview | Third Quarter 2023
63%
77%
$16,290
$915
$167
$97
$17,469
23%
Q2
Q3
$194,663 $197,914
$3,809
$4,057
$112
$108
$358
$930
$198,942 $203,009
63%
$177,620 $183,490
$2,887 $2,947
$186,437
$180,507
77%
63%
23%
77%
$17,043
$14,424
$1,110
$922
$112
$108
$358
$930
$18,435 $16,572
21%
Q4
$201,521
$4,095
$97
$645
$206,358
62%
77%
$185,880 $190,095
$3,026 $3,385
$188,906 $193,480
$15,641
$1,069
$97
$645
$17,452
2022
Q1
$206,848
$4,231
$81
$761
$211,921
20%
62%
76%
$16,753
$846
$81
$761
$18,441
21%
Q2
Q3
Q4
$210,367 $217,948 $226,276
$4,418 $4,607
$4,555
$59
$759
$215,740
62%
$191,925
$3,608
$195,533
76%
$18,442
$947
$59
$759
$20,207
23%
$759
$223,125
65%
$199,031
$3,503
$202,534
78%
$18,917
$915
$759
$20,591
24%
$689
$231,572
65%
$206,841
$3,437
$210,278
79%
$19,435
$1,170
2023
Q1
Q2
Q3
$244,598 $262,083 $264,798
$4,238
$24
$667
$249,527
$3,479
$183
$667
$266,412
$3,621
$17
$668
$269,104
24%
67%
$220,646
$3,151
$223,797
$23,952
$1,087
$24
$689
$667
$21,294 $25,730
80%
27%
68%
$235,039
$2,562
$237,601
83%
$27,044
$917
$183
$667
$28,811
28%
68%
$237,447
$2,673
$240,120
83%
$27,351
$948
$17
$668
$28,984
28%
FY
FY
2020
2021
$671,348 $781,078
$9,127 $15,462
$765 $484
$316 $2,030
$681,556 $799,054
69%
80%
63%
$615,917 $717,680 $787,892
$7,140 $11,446 $13,933
$623,057 $729,126 $801,825
29%
77%
$55,431 $63,398
$1,987 $4,016
$765 $484
$316 $2,030
$58,499 $69,928
FY
2022
$861,439
$17,811
$140
$2,968
$882,358
22%
64%
77%
$73,547
$3,878
$140
$2,968
$80,533
23%
24
WIXView entire presentation