HSBC Investor Day Presentation Deck
Cost efficiency
ratio
Adjusted costs, £bn
Costs excl. tech
Technology¹
Average number of
employees
Continued cost discipline, with reduction in physical infrastructure supporting
investment in technology
Branches
Digitally active retail
customers (Red
Brand)
1.
2.
56.5%
3.7
15%
FY19
23k
621
59%
59.5%
3.6
15%
FY20
22k
593
62%
55.5%
3.5
17%
FY21
21k²
510
Intro
65%
CMB
WPB
COO
Risk
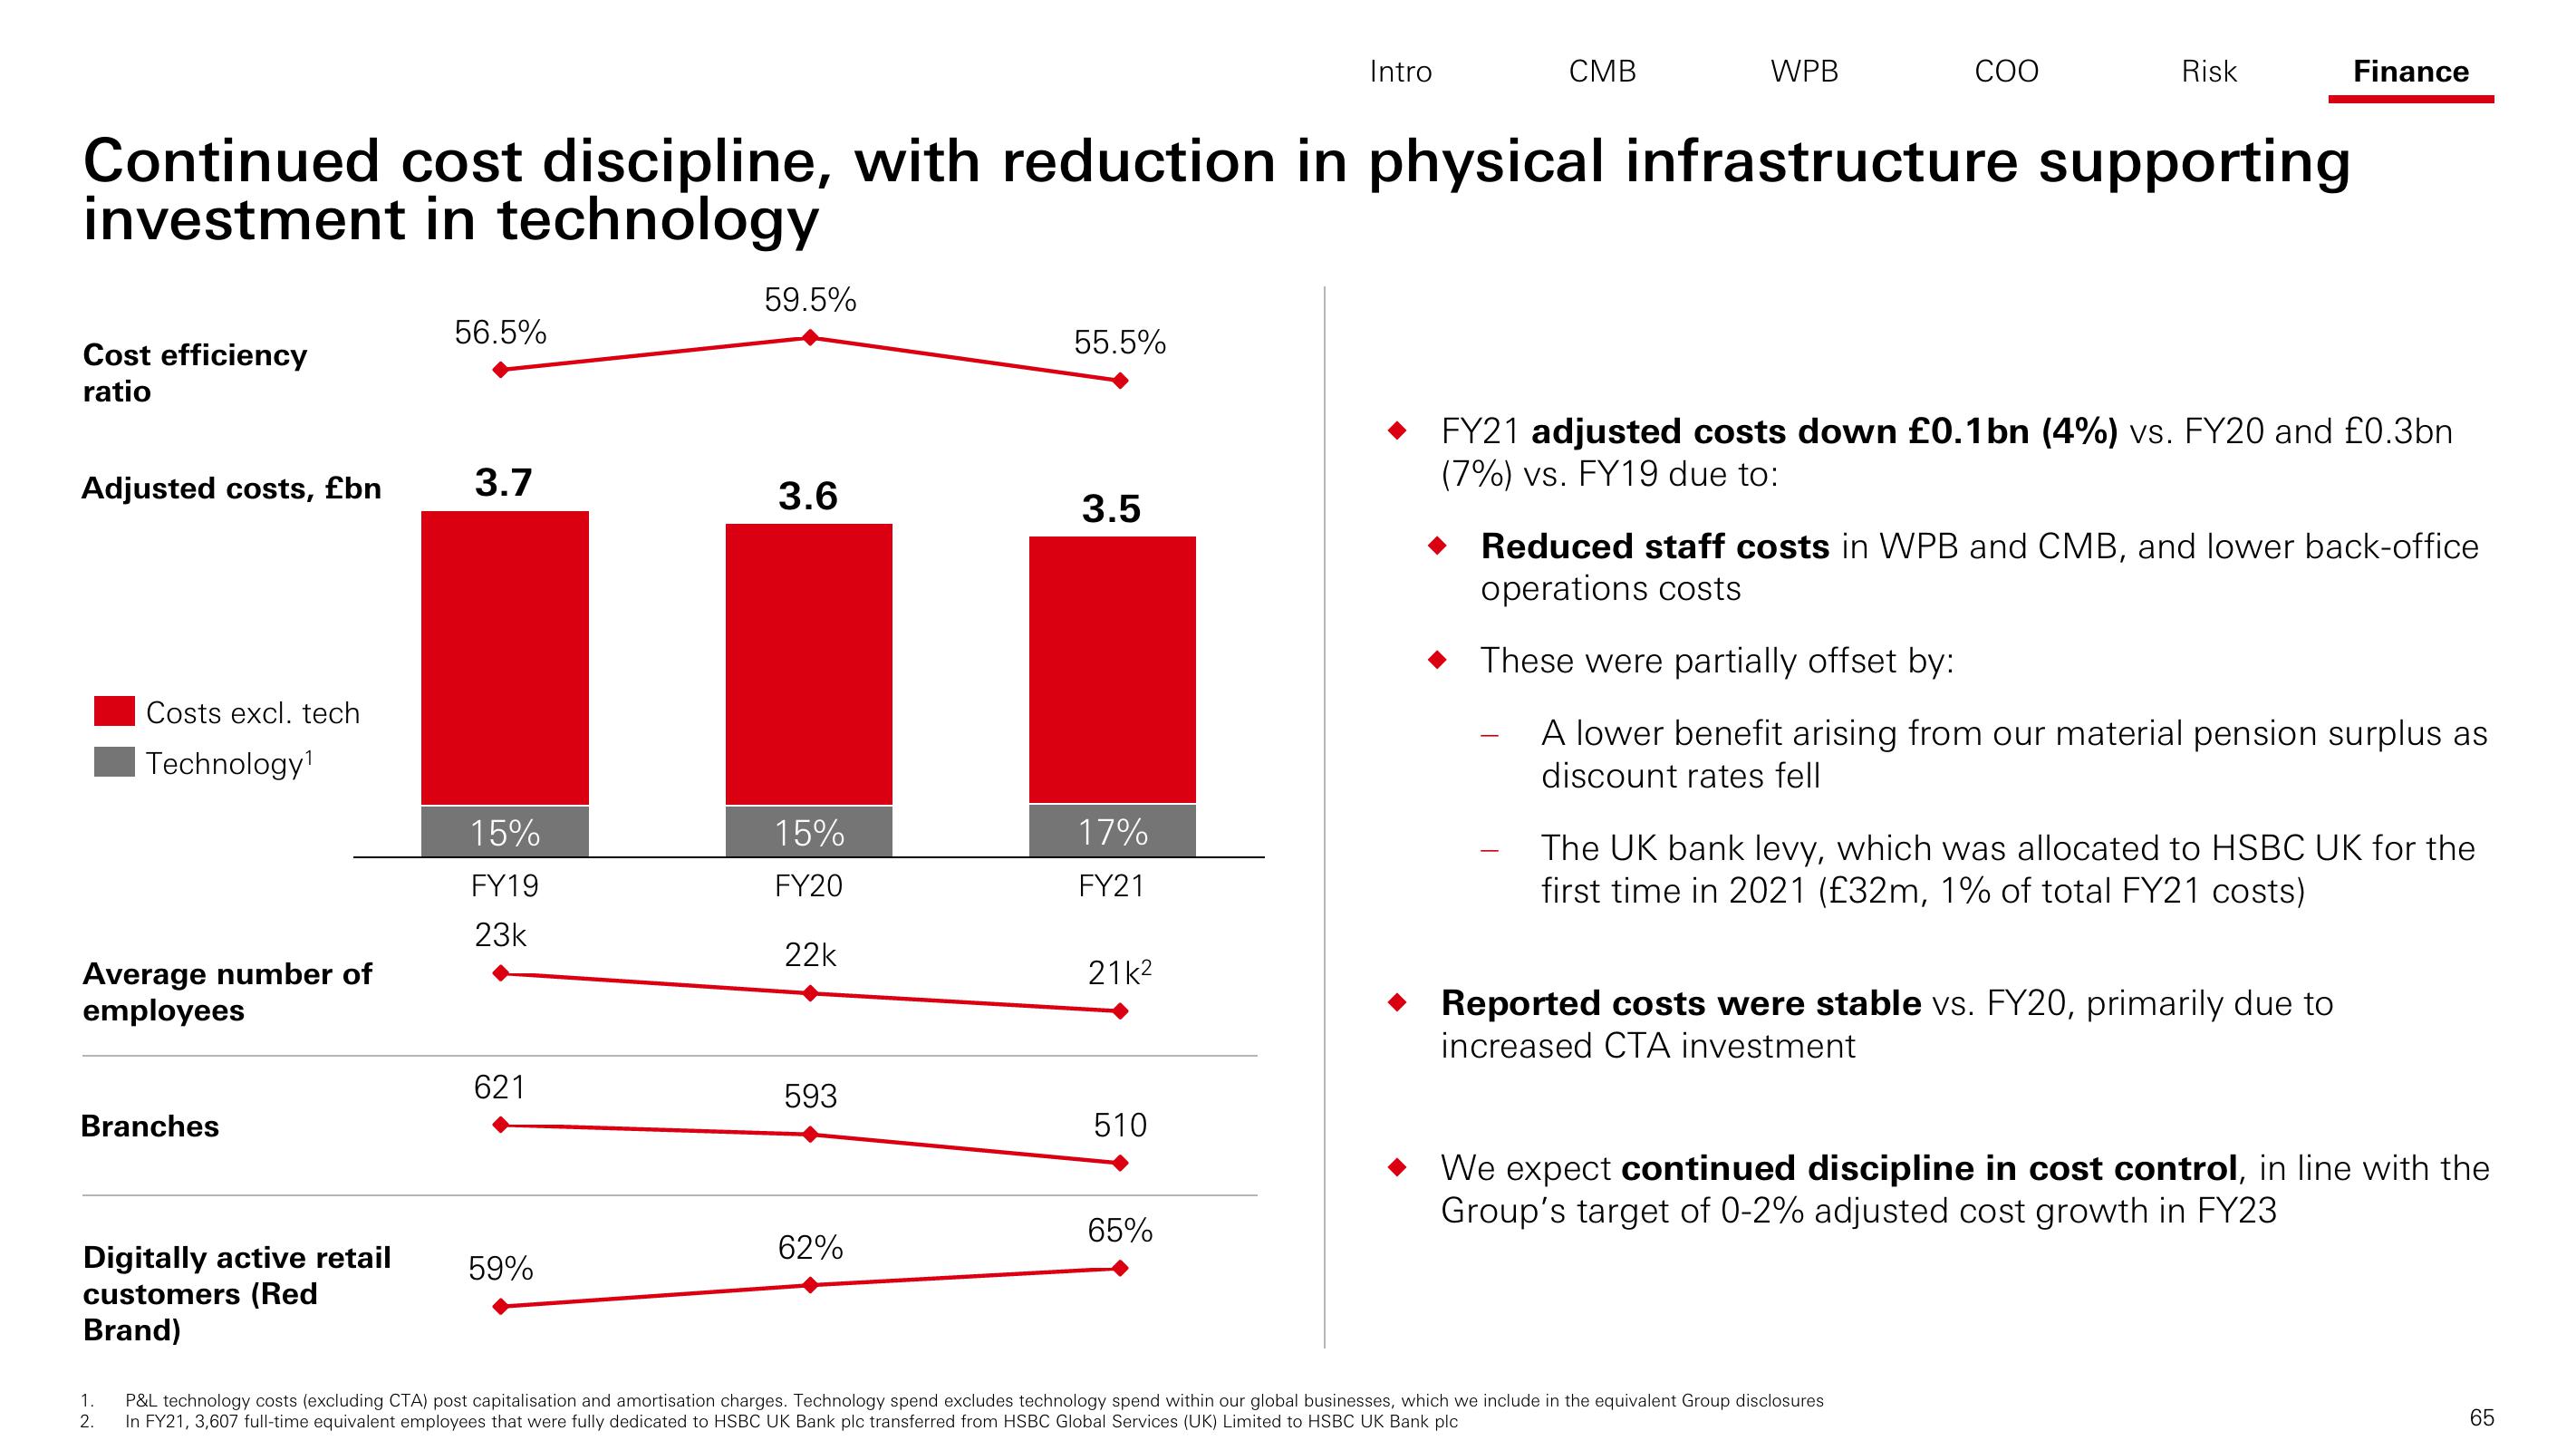
FY21 adjusted costs down £0.1bn (4%) vs. FY20 and £0.3bn
(7%) vs. FY19 due to:
Finance
Reduced staff costs in WPB and CMB, and lower back-office
operations costs
These were partially offset by:
A lower benefit arising from our material pension surplus as
discount rates fell
The UK bank levy, which was allocated to HSBC UK for the
first time in 2021 (£32m, 1% of total FY21 costs)
Reported costs were stable vs. FY20, primarily due to
increased CTA investment
P&L technology costs (excluding CTA) post capitalisation and amortisation charges. Technology spend excludes technology spend within our global businesses, which we include in the equivalent Group disclosures
In FY21, 3,607 full-time equivalent employees that were fully dedicated to HSBC UK Bank plc transferred from HSBC Global Services (UK) Limited to HSBC UK Bank plc
We expect continued discipline in cost control, in line with the
Group's target of 0-2% adjusted cost growth in FY23
65View entire presentation