Clover Health Investor Day Presentation Deck
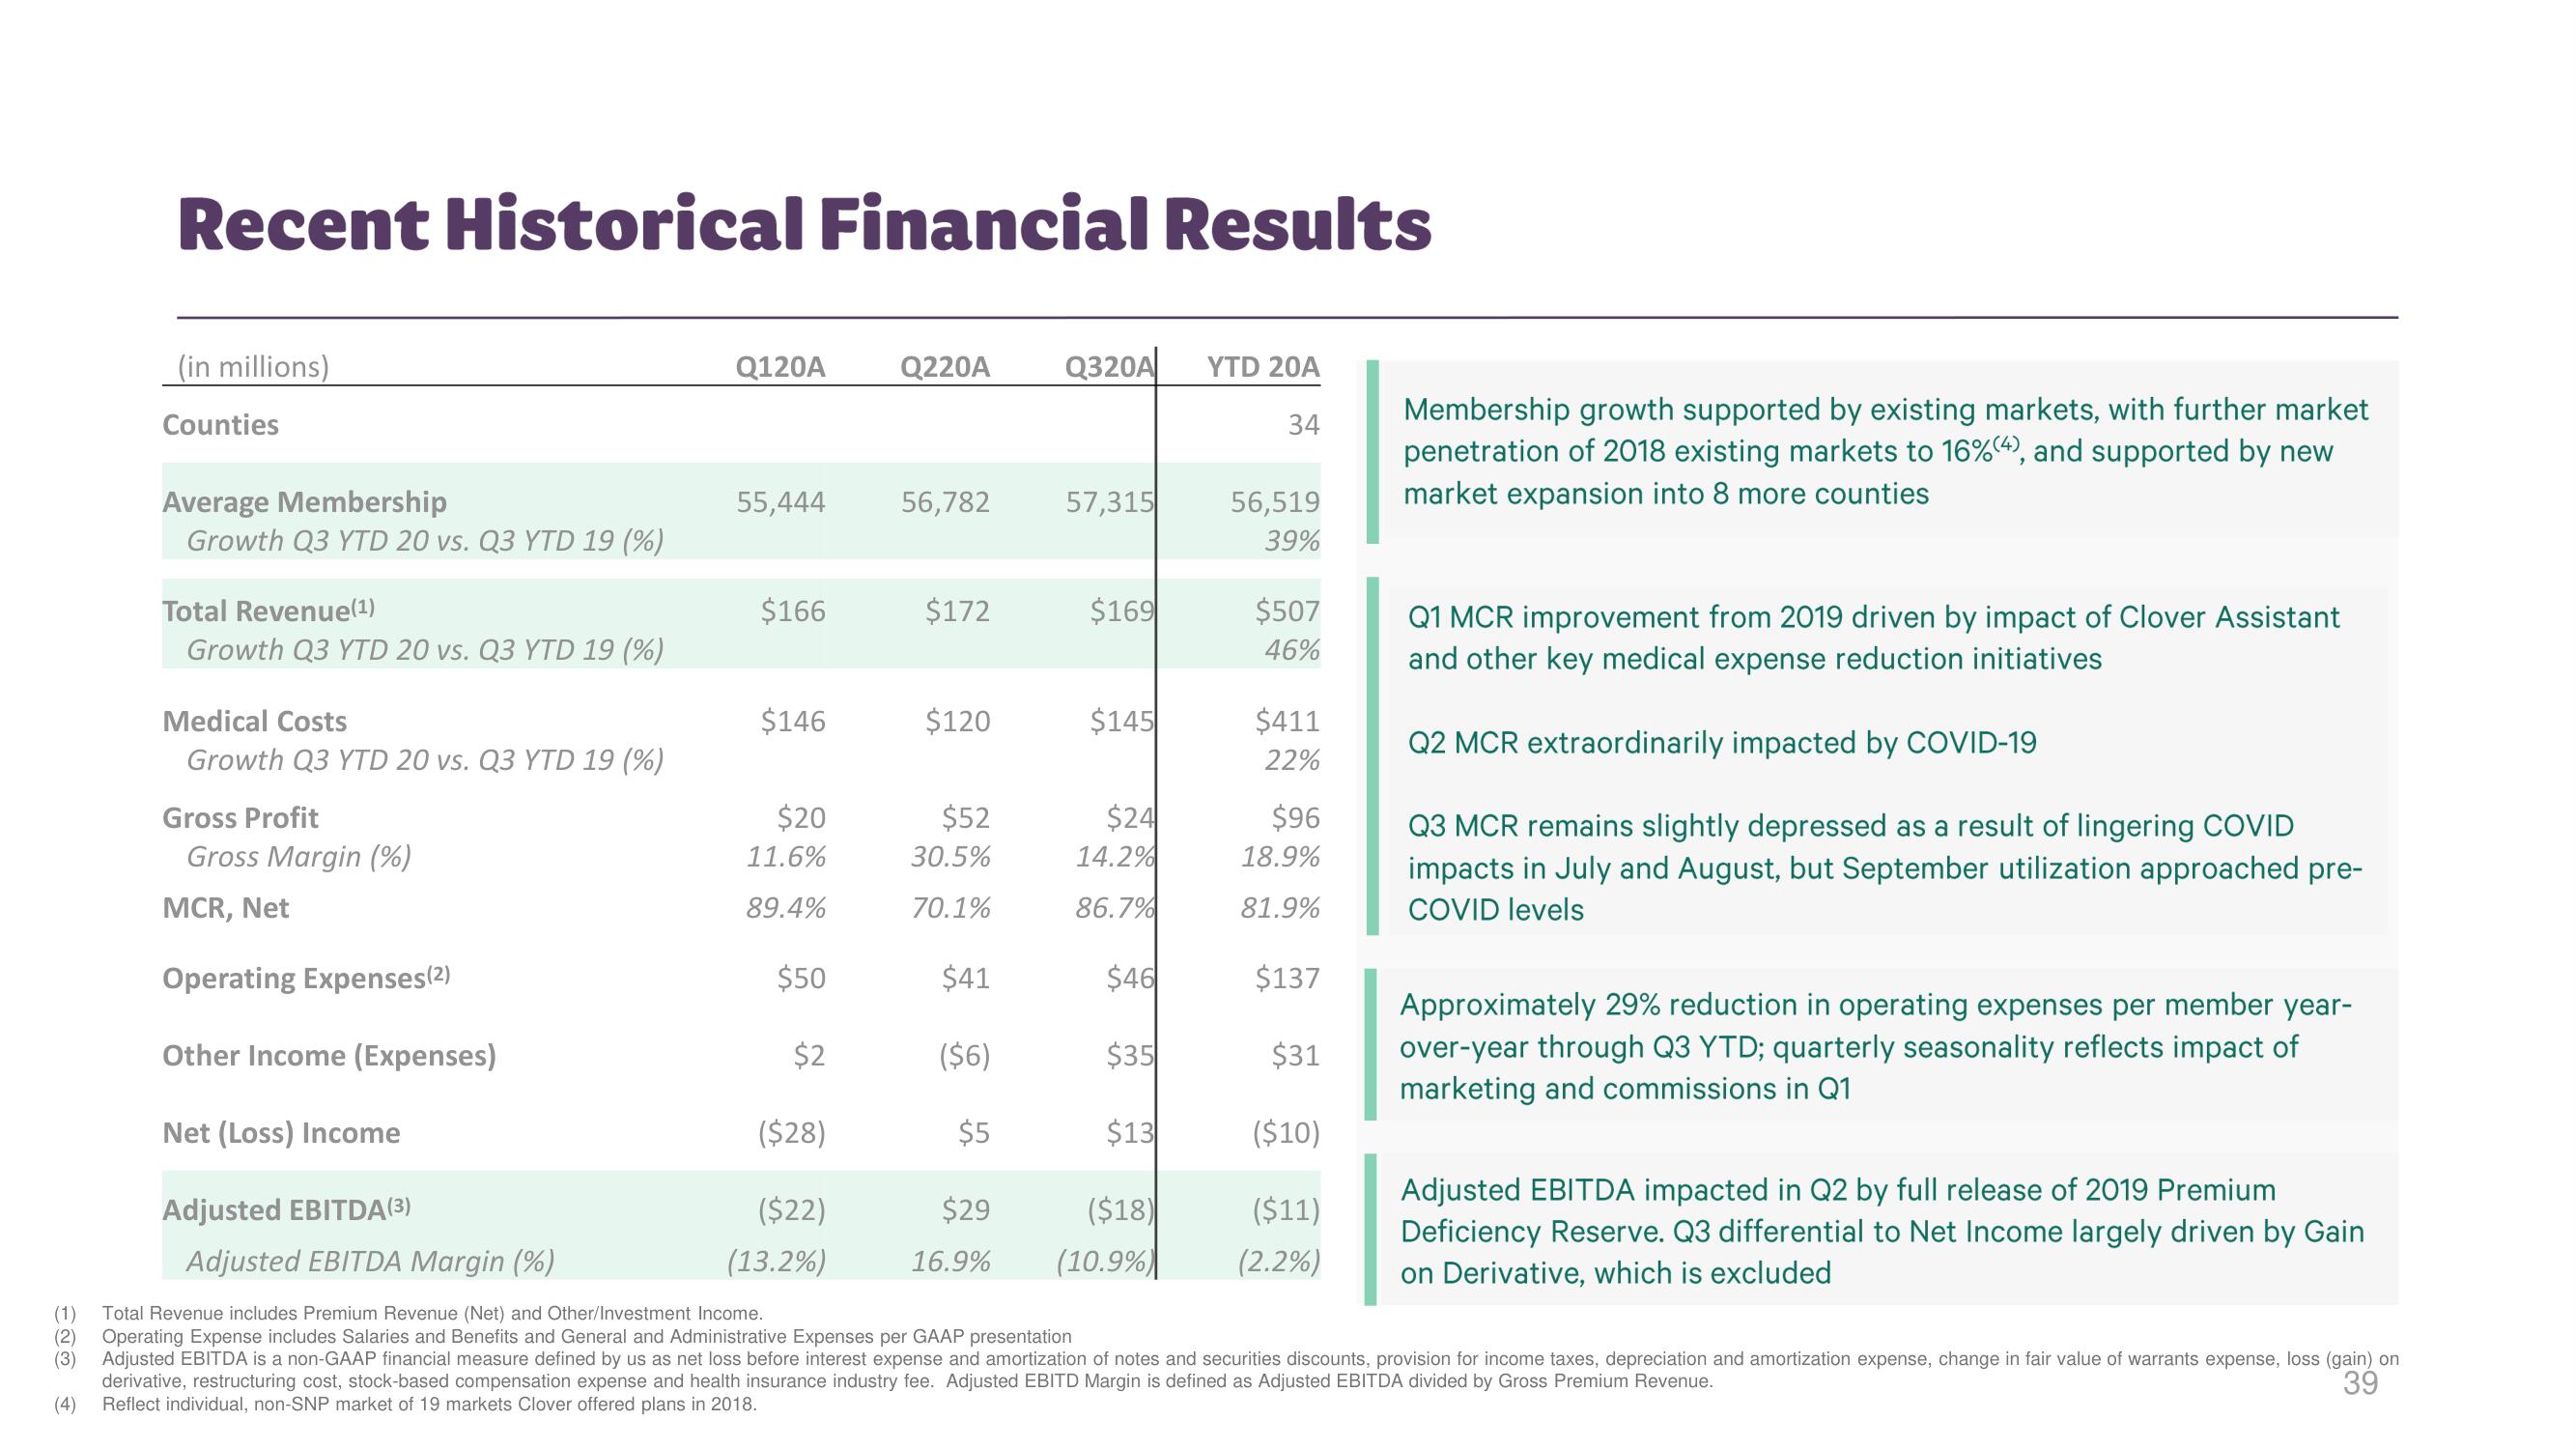
Recent Historical Financial Results
(in millions)
Counties
Average Membership
Growth Q3 YTD 20 vs. Q3 YTD 19 (%)
Total Revenue(¹)
Growth Q3 YTD 20 vs. Q3 YTD 19 (%)
Medical Costs
Growth Q3 YTD 20 vs. Q3 YTD 19 (%)
Gross Profit
Gross Margin (%)
MCR, Net
Q120A
55,444
$166
$146
$20
11.6%
89.4%
$50
$2
Q220A Q320A
($28)
($22)
(13.2%)
56,782
$172
$120
$52
30.5%
70.1%
$41
($6)
$5
57,315
$29
16.9%
$169
$145
$24
14.2%
86.7%
$46
$35
$13
YTD 20A
34
Operating Expenses(2)
Other Income (Expenses)
Net (Loss) Income
Adjusted EBITDA (3)
Adjusted EBITDA Margin (%)
(1)
Total Revenue includes Premium Revenue (Net) and Other/Investment Income.
(2) Operating Expense includes Salaries and Benefits and General and Administrative Expenses per GAAP presentation
(3) Adjusted EBITDA is a non-GAAP financial measure defined by us as net loss before interest expense and amortization of notes and securities discounts, provision for income taxes, depreciation and amortization expense, change in fair value of warrants expense, loss (gain) on
derivative, restructuring cost, stock-based compensation expense and health insurance industry fee. Adjusted EBITD Margin is defined Adjusted EBITDA divided by Gross Premium Revenue.
39
(4) Reflect individual, non-SNP market of 19 markets Clover offered plans in 2018.
($18)
(10.9%)
56,519
39%
$507
46%
$411
22%
$96
18.9%
81.9%
$137
$31
($10)
($11)
(2.2%)
Membership growth supported by existing markets, with further market
penetration of 2018 existing markets to 16%(4), and supported by new
market expansion into 8 more counties
Q1 MCR improvement from 2019 driven by impact of Clover Assistant
and other key medical expense reduction initiatives
Q2 MCR extraordinarily impacted by COVID-19
Q3 MCR remains slightly depressed as a result of lingering COVID
impacts in July and August, but September utilization approached pre-
COVID levels
Approximately 29% reduction in operating expenses per member year-
over-year through Q3 YTD; quarterly seasonality reflects impact of
marketing and commissions in Q1
Adjusted EBITDA impacted in Q2 by full release of 2019 Premium
Deficiency Reserve. Q3 differential to Net Income largely driven by Gain
on Derivative, which is excludedView entire presentation