Maersk Investor Presentation Deck
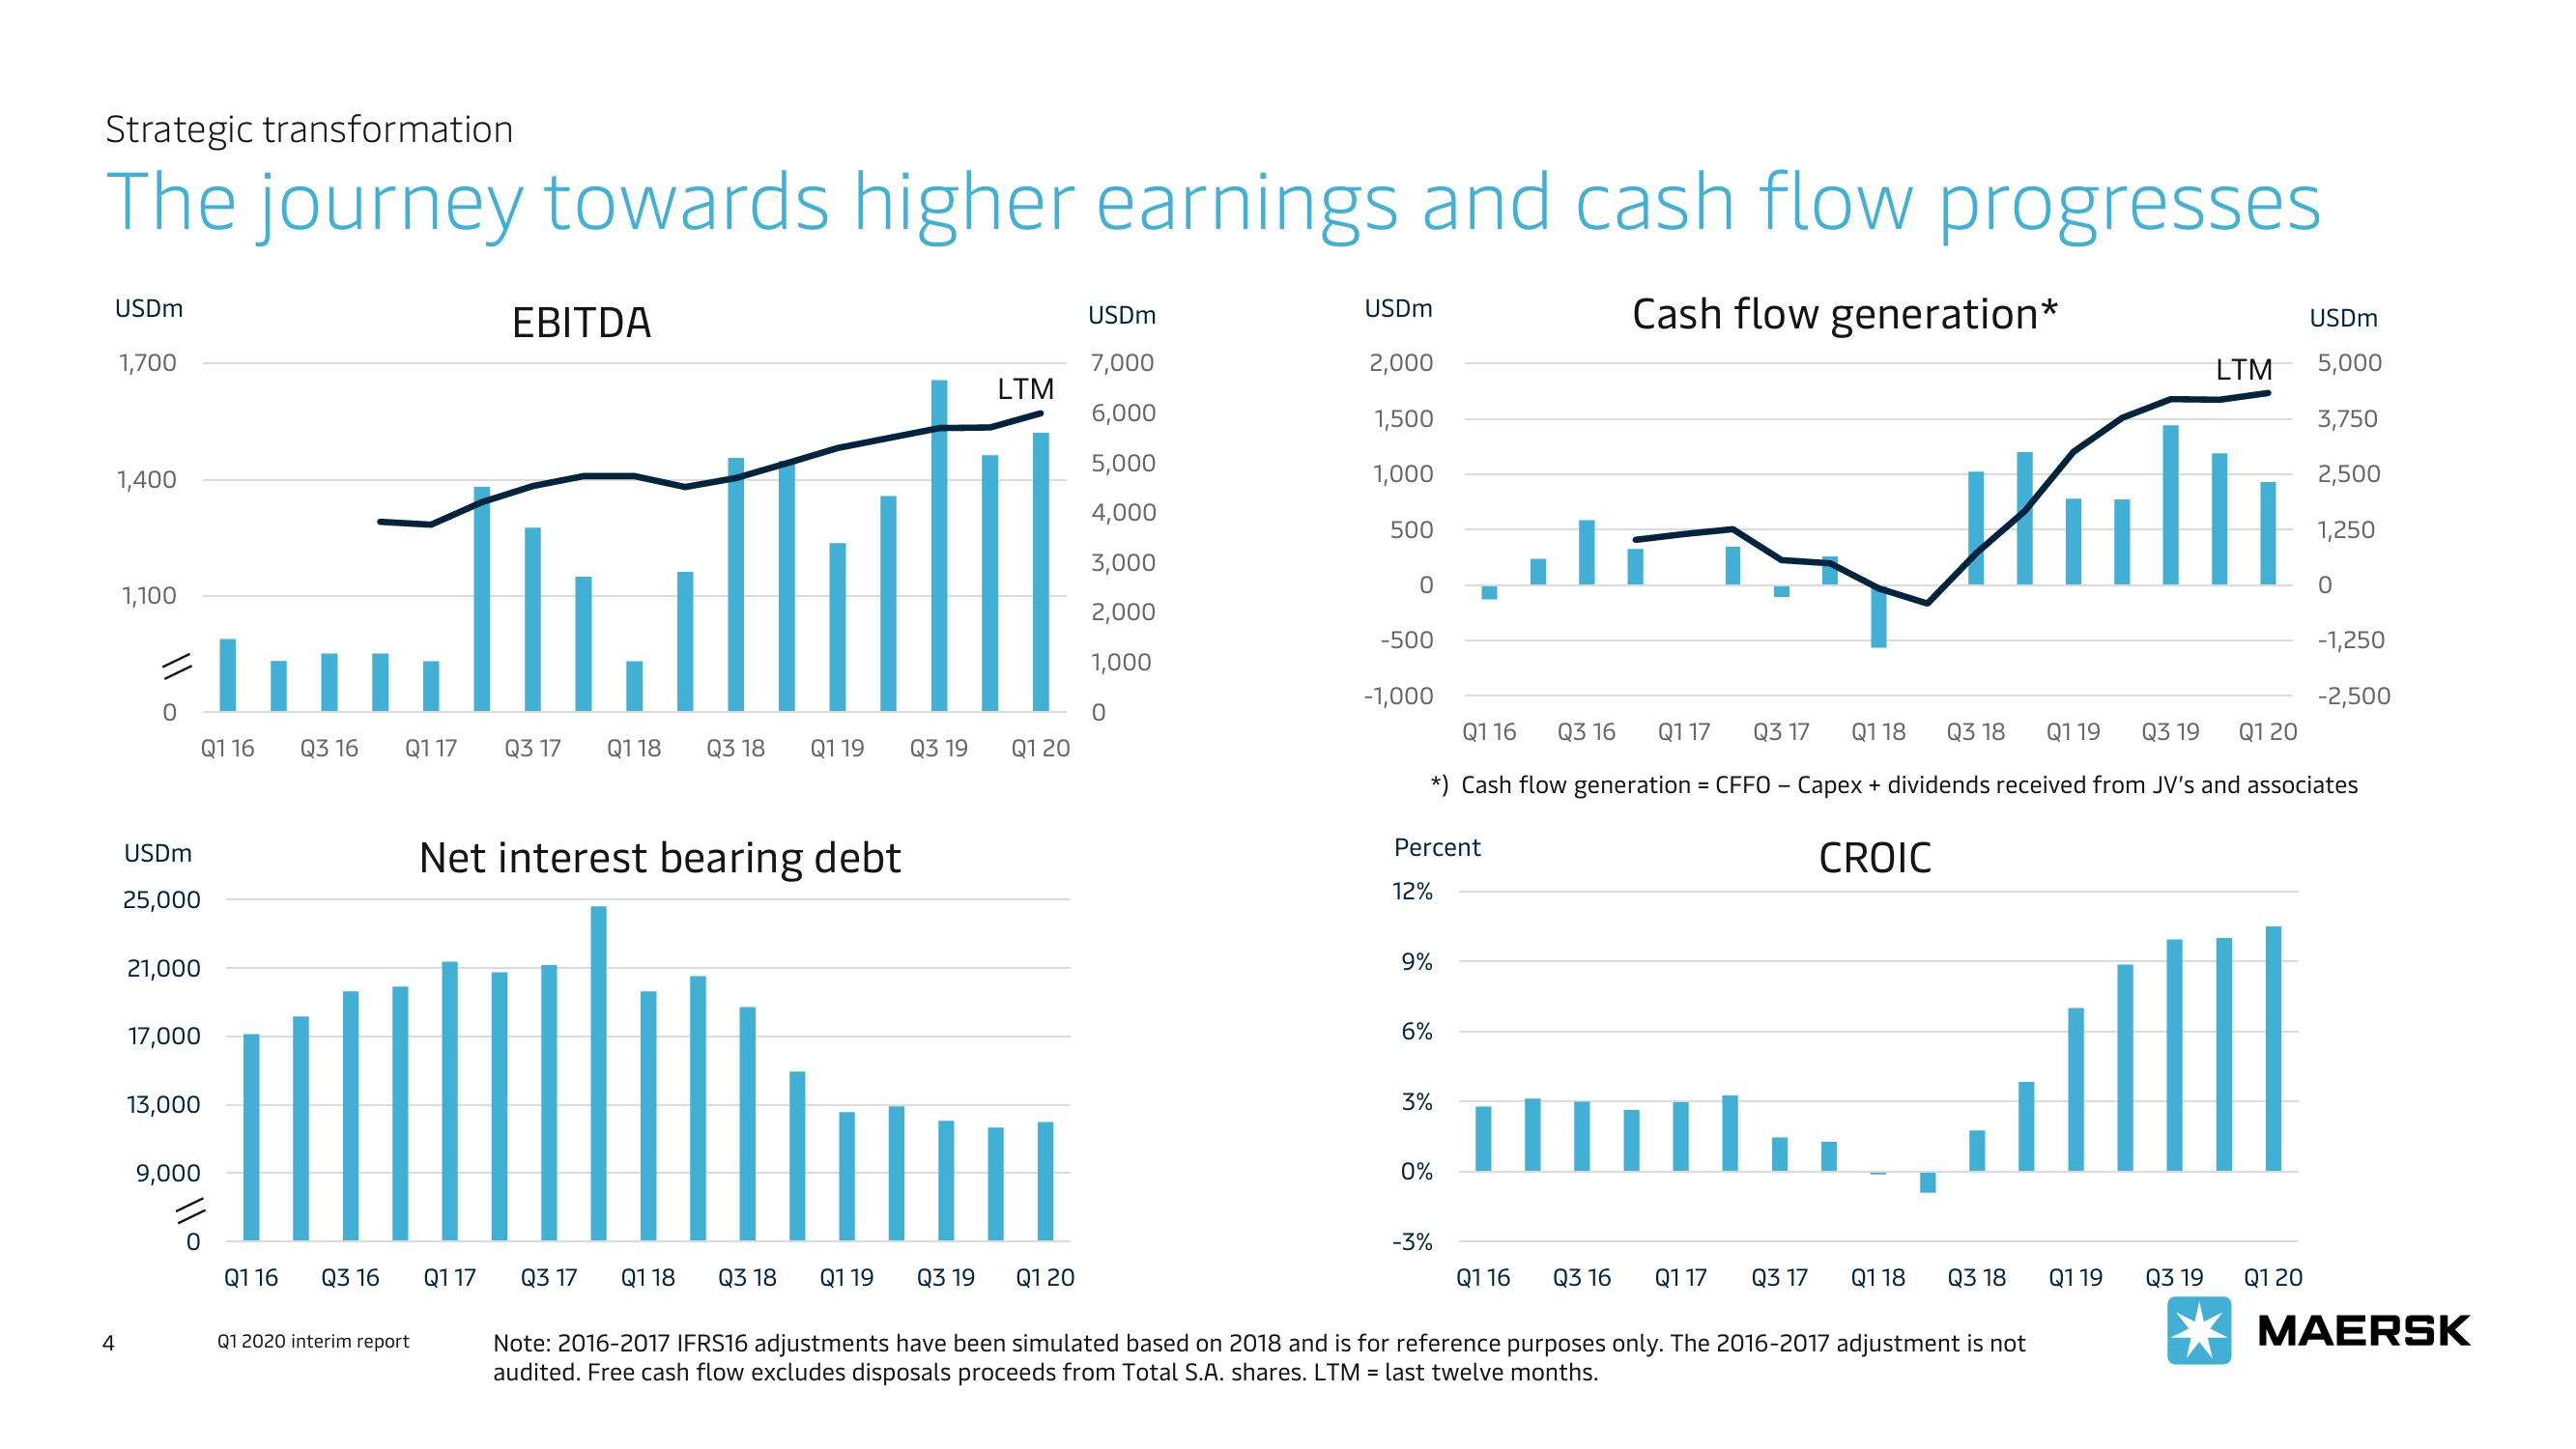
Strategic transformation
The journey towards higher earnings and cash flow progresses
Cash flow generation*
USDm
4
1,700
1,400
1,100
0
Q116
USDm
25,000
21,000
17,000
13,000
9,000
0
Q116
Q3 16
Q3 16
Q117 Q3 17 Q1 18 Q3 18 Q1 19
Q1 2020 interim report
EBITDA
Net interest bearing debt
Q117
Q3 17
Q1 18 Q3 18 Q1 19
Q3 19
LTM
Q3 19
Q1 20
THE
Q1 20
USDm
7,000
6,000
5,000
4,000
3,000
2,000
1,000
0
USDm
2,000
1,500
1,000
500
0
-500
-1,000
Percent
12%
9%
6%
Q1 19 Q3 19 Q1 20
Q116 Q3 16 Q1 17
Q3 17 Q1 18
*) Cash flow generation = CFFO - Capex + dividends received from JV's and associates
CROIC
3%
0%
-3%
Q116 Q3 16
Q1 17
I
Q3 17
Hilli
Q3 18
Q1 18 Q3 18
Note: 2016-2017 IFRS16 adjustments have been simulated based on 2018 and is for reference purposes only. The 2016-2017 adjustment is not
audited. Free cash flow excludes disposals proceeds from Total S.A. shares. LTM = last twelve months.
USDm
LTM 5,000
3,750
2,500
1,250
Q1 19
Q3 19
0
Q1 20
-1,250
-2,500
MAERSKView entire presentation