Zegna Results Presentation Deck
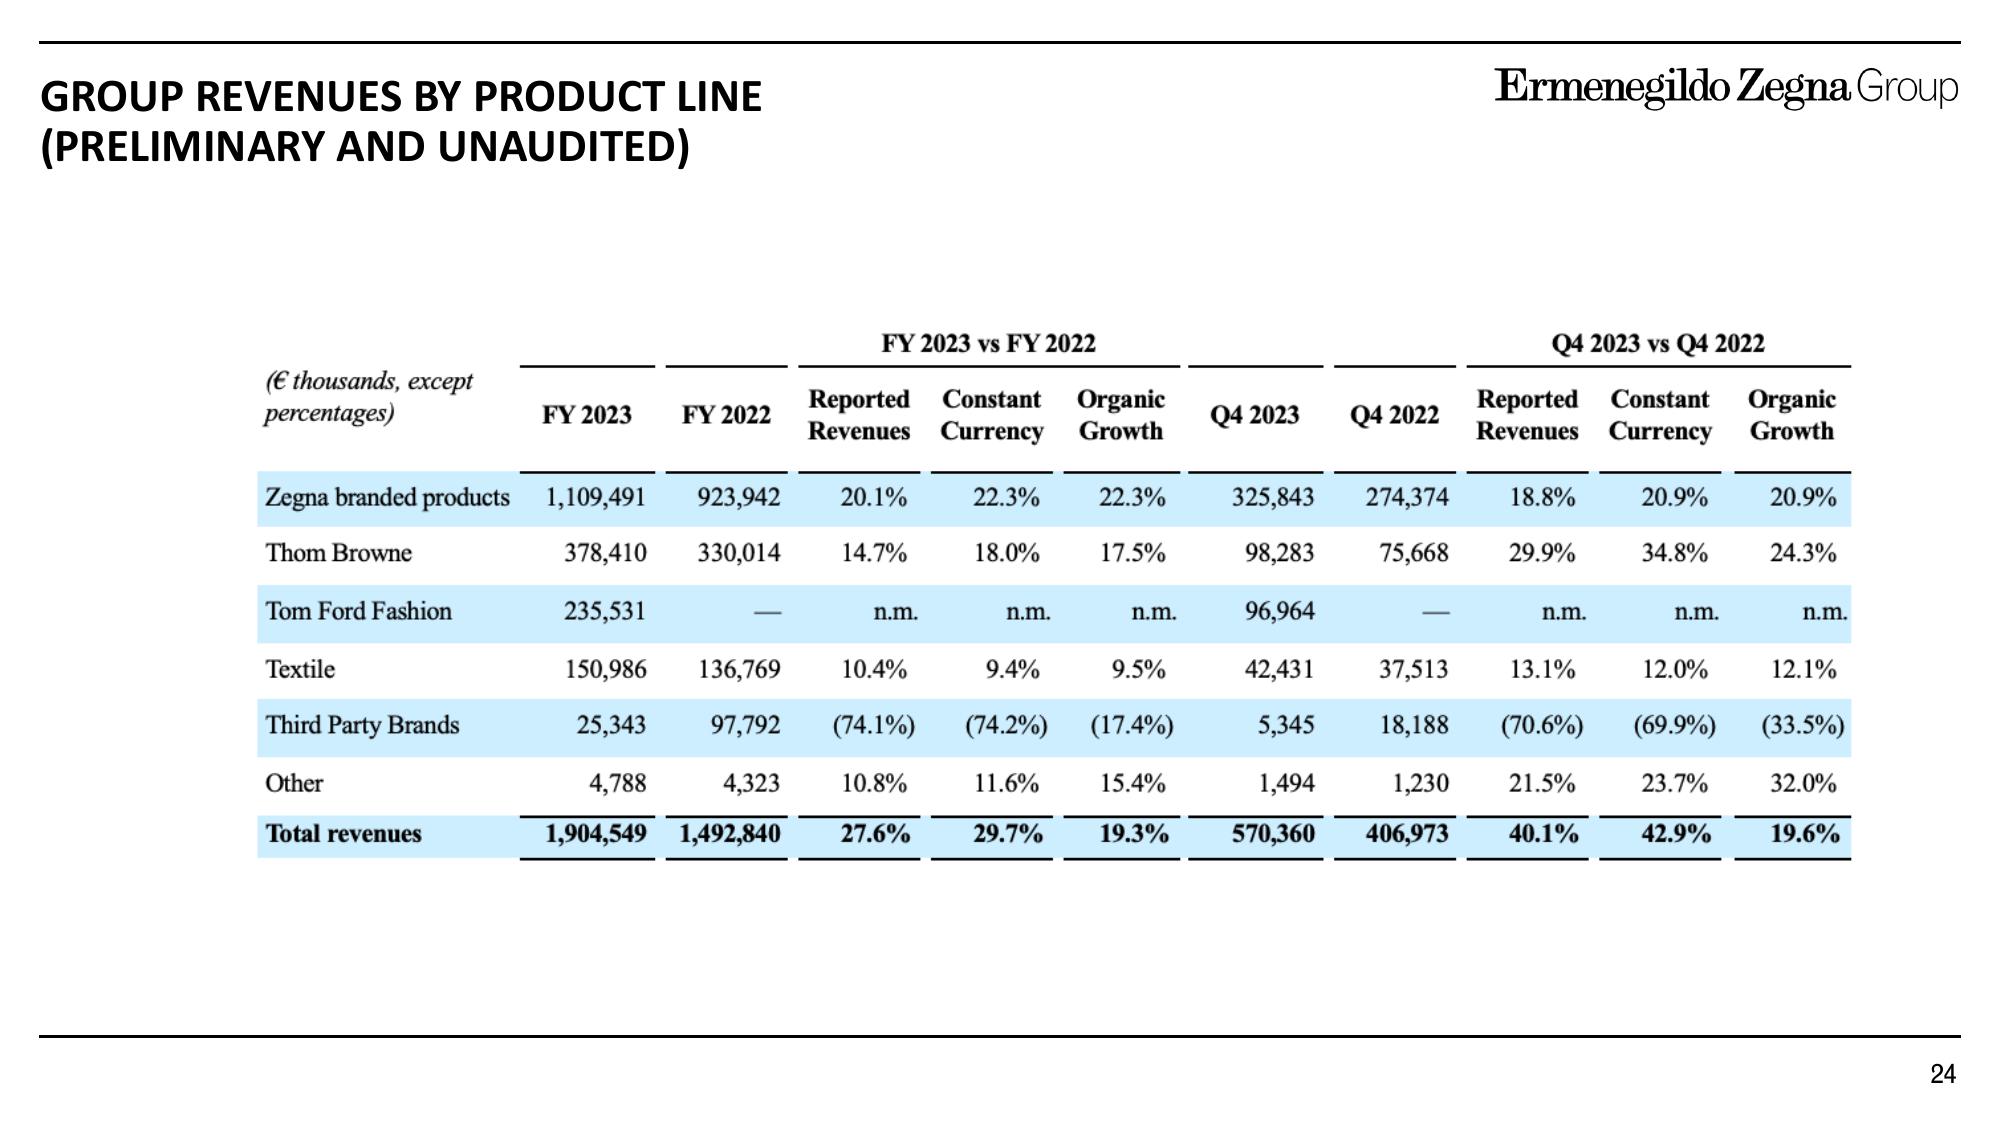
GROUP REVENUES BY PRODUCT LINE
(PRELIMINARY AND UNAUDITED)
(€ thousands, except
percentages)
Zegna branded products
Thom Browne
Tom Ford Fashion
Textile
Third Party Brands
Other
Total revenues
FY 2023
FY 2022
FY 2023 vs FY 2022
Reported Constant Organic
Revenues Currency Growth
923,942 20.1%
330,014 14.7%
1,109,491
378,410
235,531
150,986 136,769 10.4%
25,343
4,788
4,323
1,904,549 1,492,840
n.m.
22.3%
10.8%
27.6%
18.0%
n.m.
9.4%
22.3%
11.6%
29.7%
17.5%
n.m.
97,792 (74.1%) (74.2%) (17.4%)
15.4%
19.3%
9.5%
Q4 2023
Q4 2022
Ermenegildo Zegna Group
Q4 2023 vs Q4 2022
Reported Constant Organic
Revenues Currency Growth
325,843
98,283
96,964
42,431
37,513
12.0%
5,345
(70.6%) (69.9%)
18,188
1,230
1,494
21.5%
570,360 406,973 40.1%
274,374
75,668 29.9%
18.8%
n.m.
20.9%
13.1%
34.8%
n.m.
23.7%
42.9%
20.9%
24.3%
n.m.
12.1%
(33.5%)
32.0%
19.6%
24View entire presentation