J.P.Morgan Results Presentation Deck
Asset & Wealth Management¹
SELECTED INCOME STATEMENT DATA ($MM)
Revenue
Asset Management
Global Private Bank
Expense
Credit costs
Net income
Average equity
ROE
Pretax margin
Assets under management ("AUM")
Client assets
Reported
$4,943
2,128
Average loans
Average deposits
2,815
KEY DRIVERS / STATISTICS ($B)²
3,163
145
$1,226
Reported
$16.7
29%
33
$3,188
4,558
219.5
211.9
2Q23
FR impact
$303
303
146
$119
2Q23
FR impact
$0.7
2%
1
9.7
ex. FR
$4,640
2,128
2,512
3,163
(1)
$1,107
ex. FR
$16.0
27%
32
$3,188
4,558
209.8
211.9
ex. FR $ 0/(U)
1Q23
($144)
(306)
162
72
(29)
($260)
ex. FR
1Q23
$16.0
34%
35
4,347
211.5
2Q22
224.4
$334
(9)
343
244
(45)
$103
2Q22
$17.0
$3,006 $2,743
3,798
23%
31
216.8
268.9
CCB
CIB
AWM Corp.
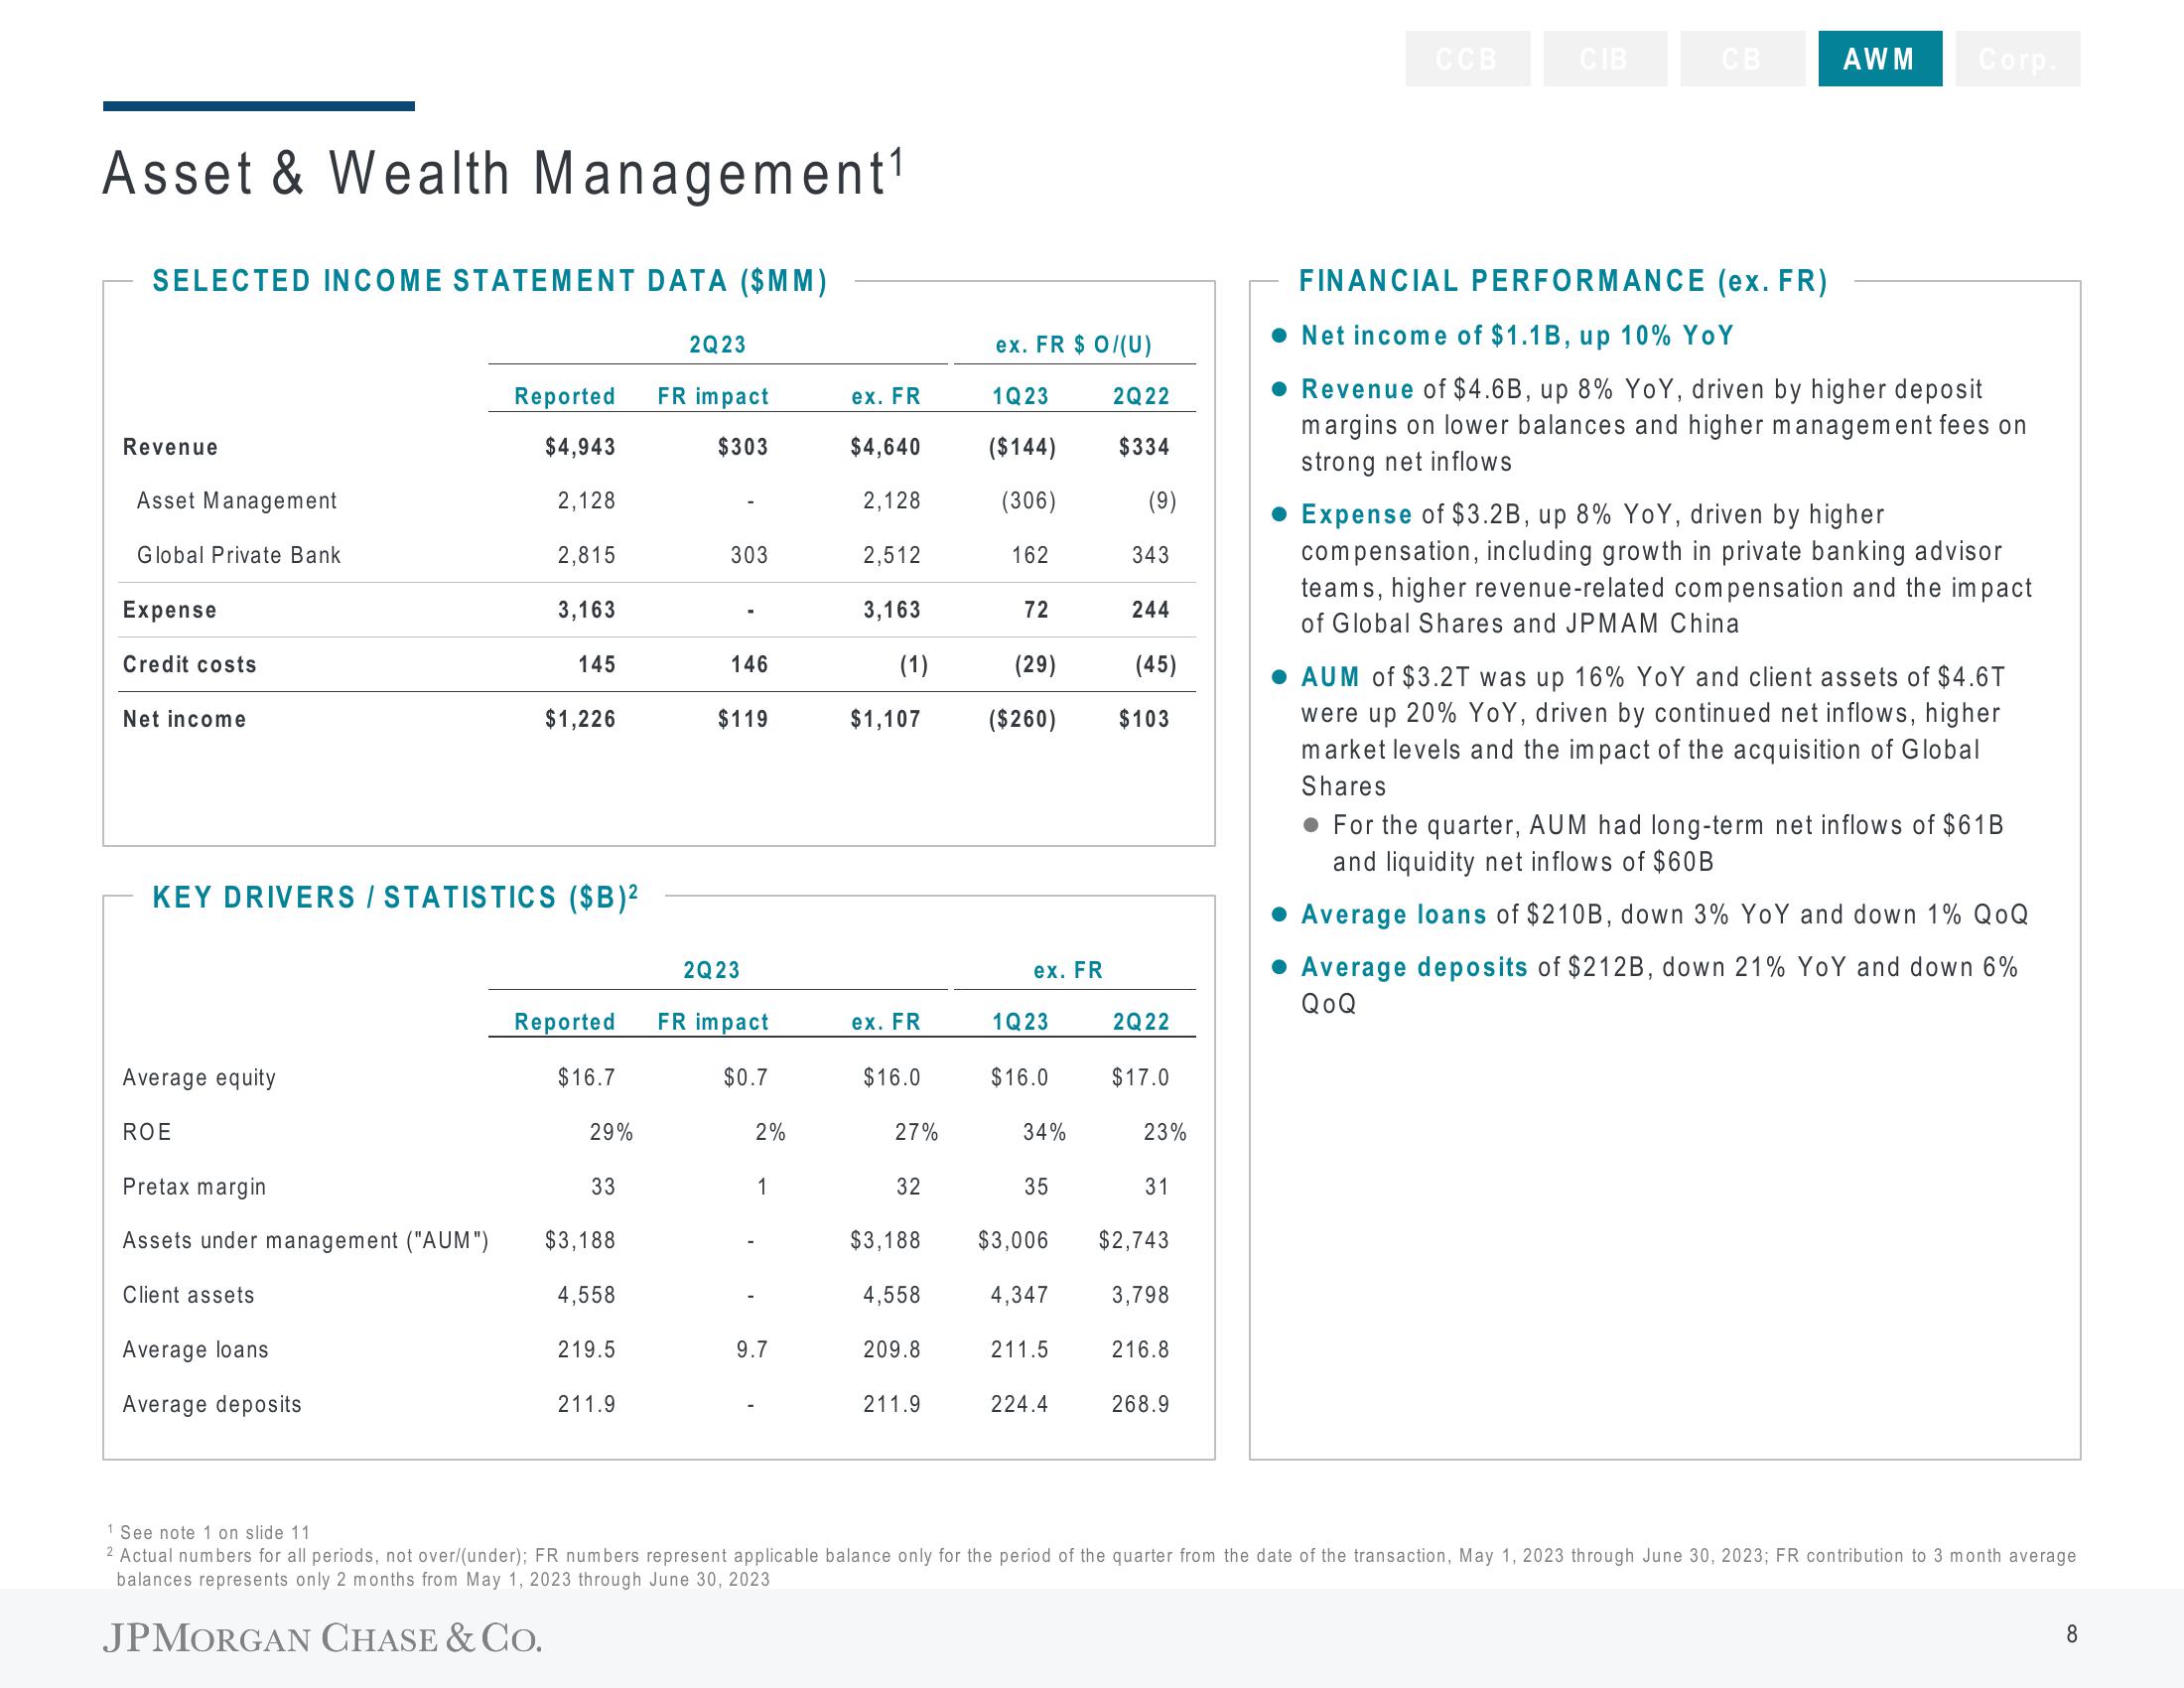
FINANCIAL PERFORMANCE (ex. FR)
Net income of $1.1B, up 10% YoY
Revenue of $4.6B, up 8% YoY, driven by higher deposit
margins on lower balances and higher management fees on
strong net inflows
Expense of $3.2B, up 8% YoY, driven by higher
compensation, including growth in private banking advisor
teams, higher revenue-related compensation and the impact
of Global Shares and JPMAM China
AUM of $3.2T was up 16% YoY and client assets of $4.6T
were up 20% YoY, driven by continued net inflows, higher
market levels and the impact of the acquisition of Global
Shares
For the quarter, AUM had long-term net inflows of $61B
and liquidity net inflows of $60B
Average loans of $210B, down 3% YoY and down 1% QOQ
Average deposits of $212B, down 21% YoY and down 6%
QoQ
1 See note 1 on slide 11
2 Actual numbers for all periods, not over/(under); FR numbers represent applicable balance only for the period of the quarter from the date of the transaction, May 1, 2023 through June 30, 2023; FR contribution to 3 month average
balances represents only 2 months from May 1, 2023 through June 30, 2023
JPMORGAN CHASE & CO.
8View entire presentation