Kinnevik Results Presentation Deck slide image

Kinnevik Results Presentation Deck

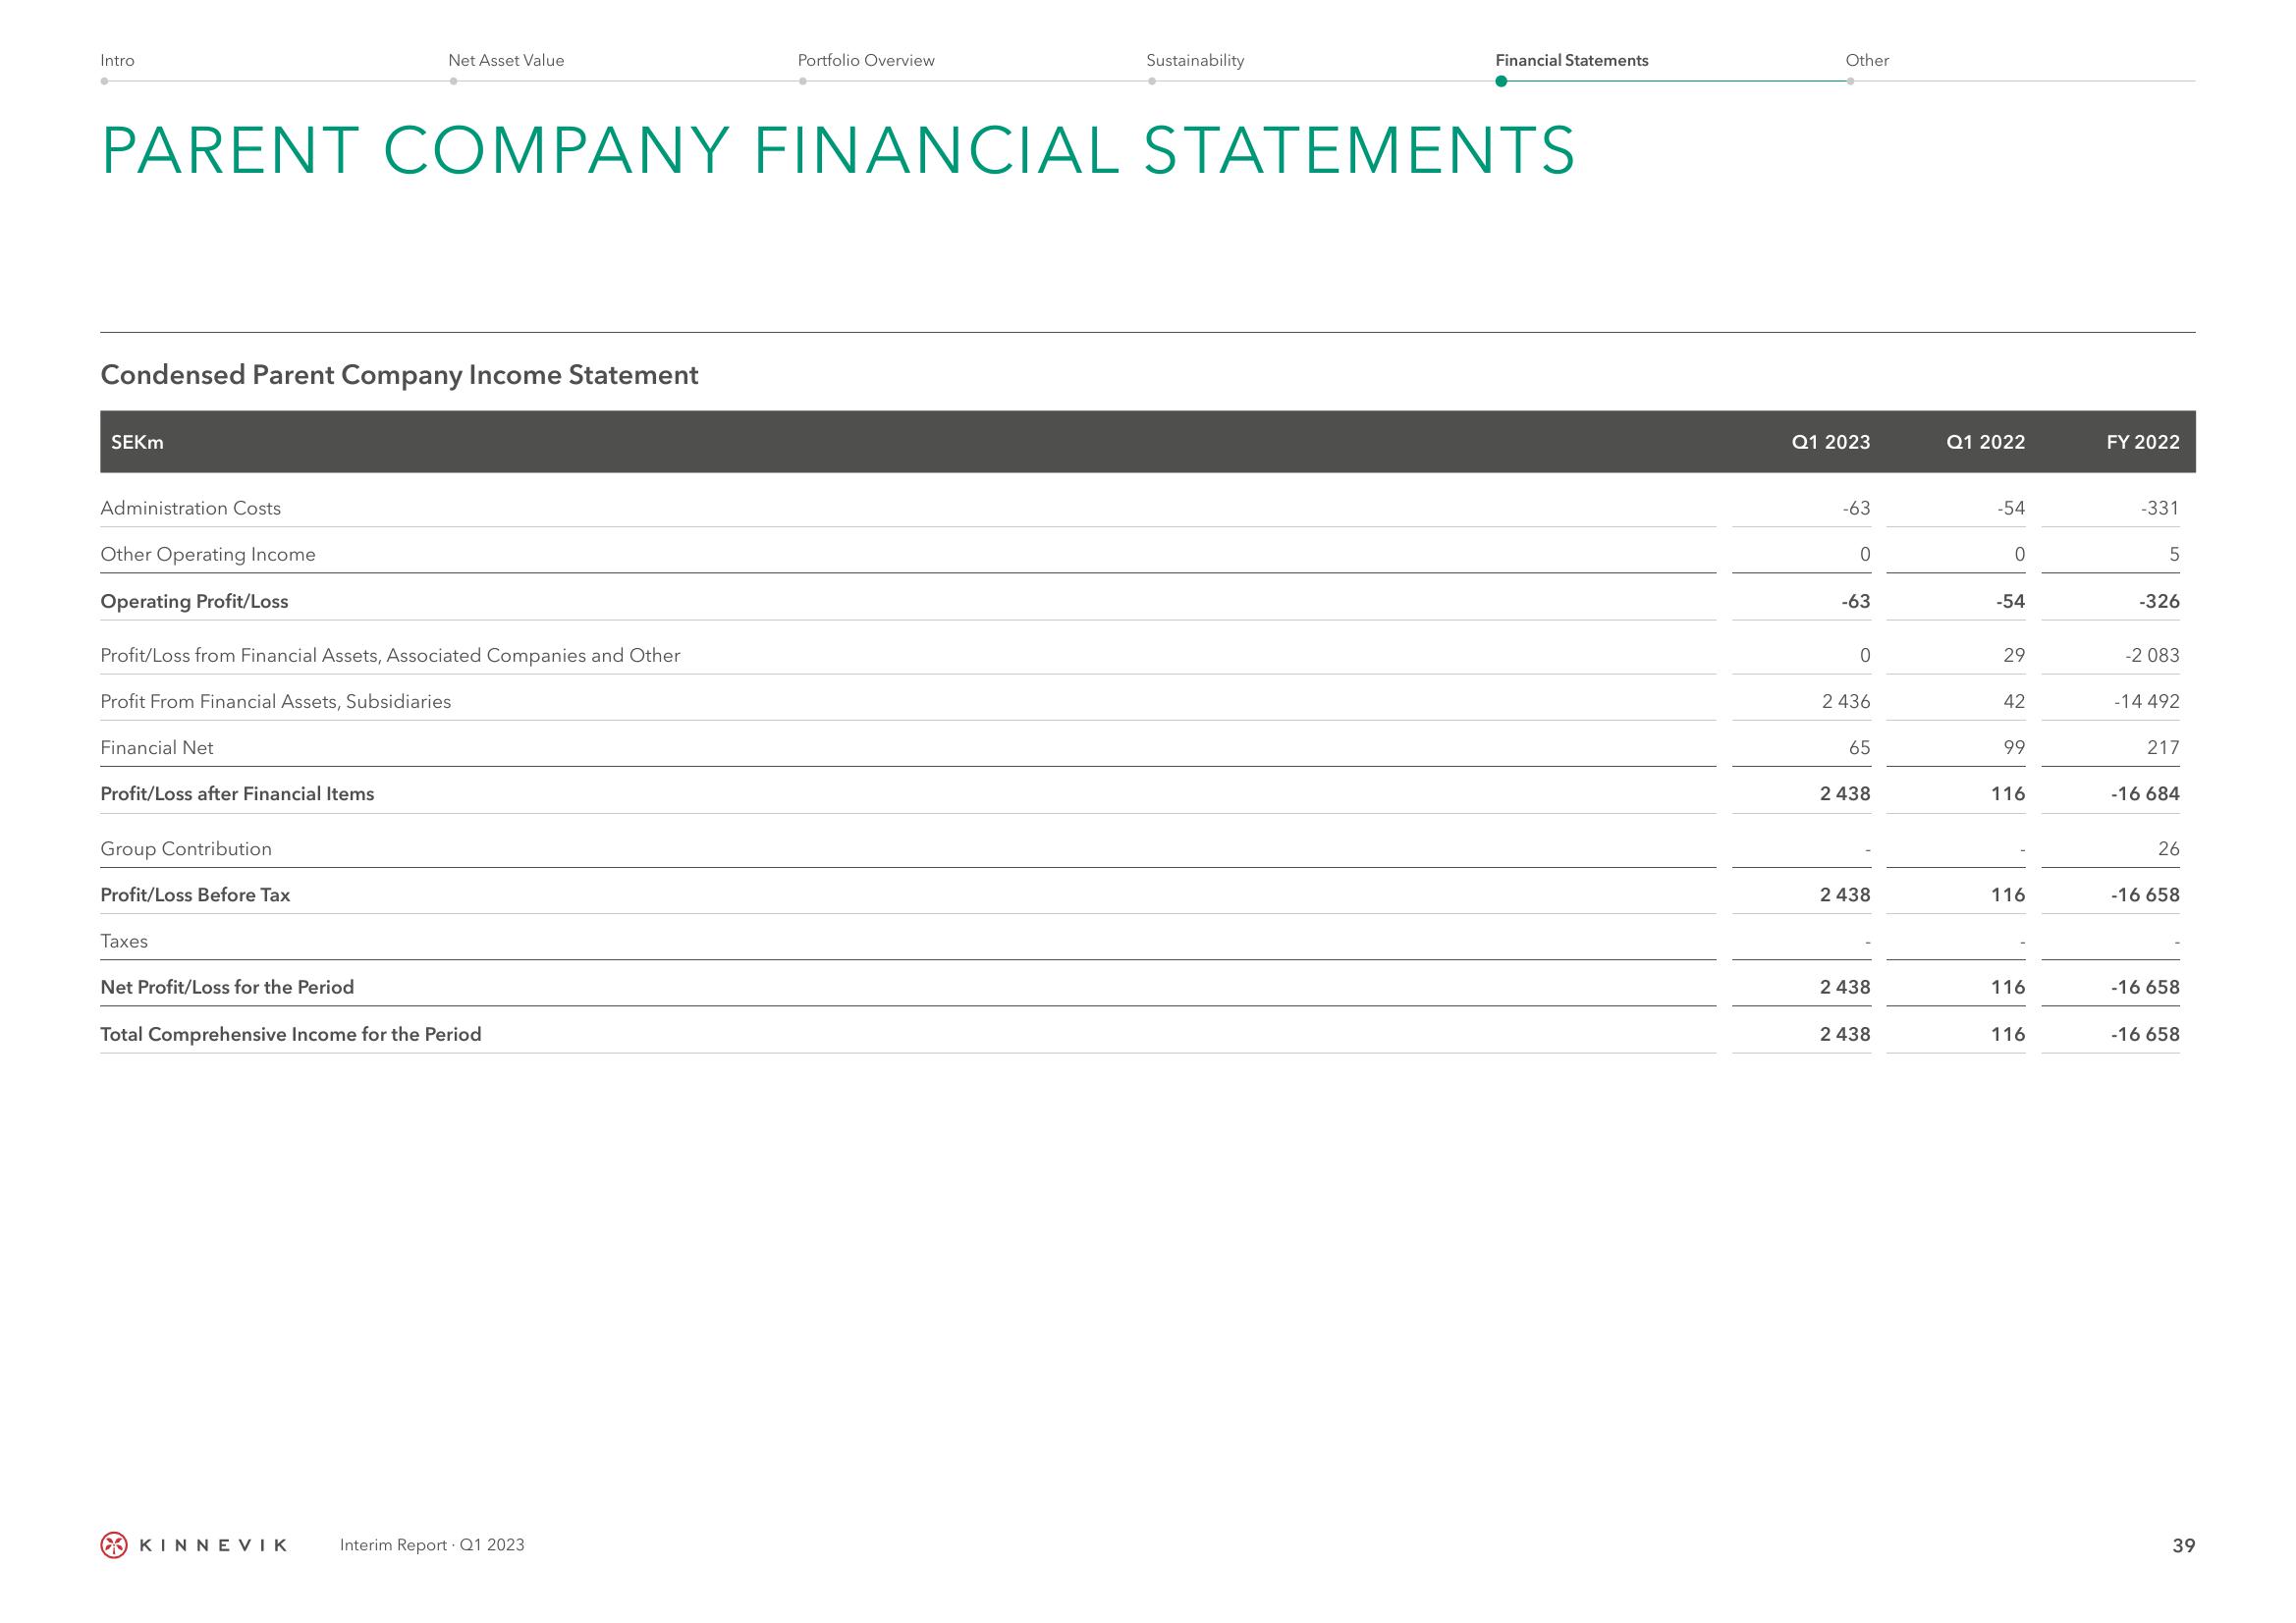
Intro Condensed Parent Company Income Statement SEKM Administration Costs PARENT COMPANY FINANCIAL STATEMENTS Other Operating Income Operating Profit/Loss Profit/Loss from Financial Assets, Associated Companies and Other Profit From Financial Assets, Subsidiaries Financial Net Profit/Loss after Financial Items Group Contribution Net Asset Value Profit/Loss Before Tax Taxes Net Profit/Loss for the Period Total Comprehensive Income for the Period KINNEVIK Portfolio Overview Interim Report Q1 2023 Sustainability Financial Statements Other Q1 2023 -63 0 -63 0 2 436 65 2438 2 438 2 438 2 438 Q1 2022 -54 0 -54 29 42 99 116 116 116 116 FY 2022 -331 5 -326 -2 083 -14 492 217 -16 684 26 -16 658 -16 658 -16 658 39
View entire presentation