Morgan Stanley Investment Banking Pitch Book
Project Roosevelt
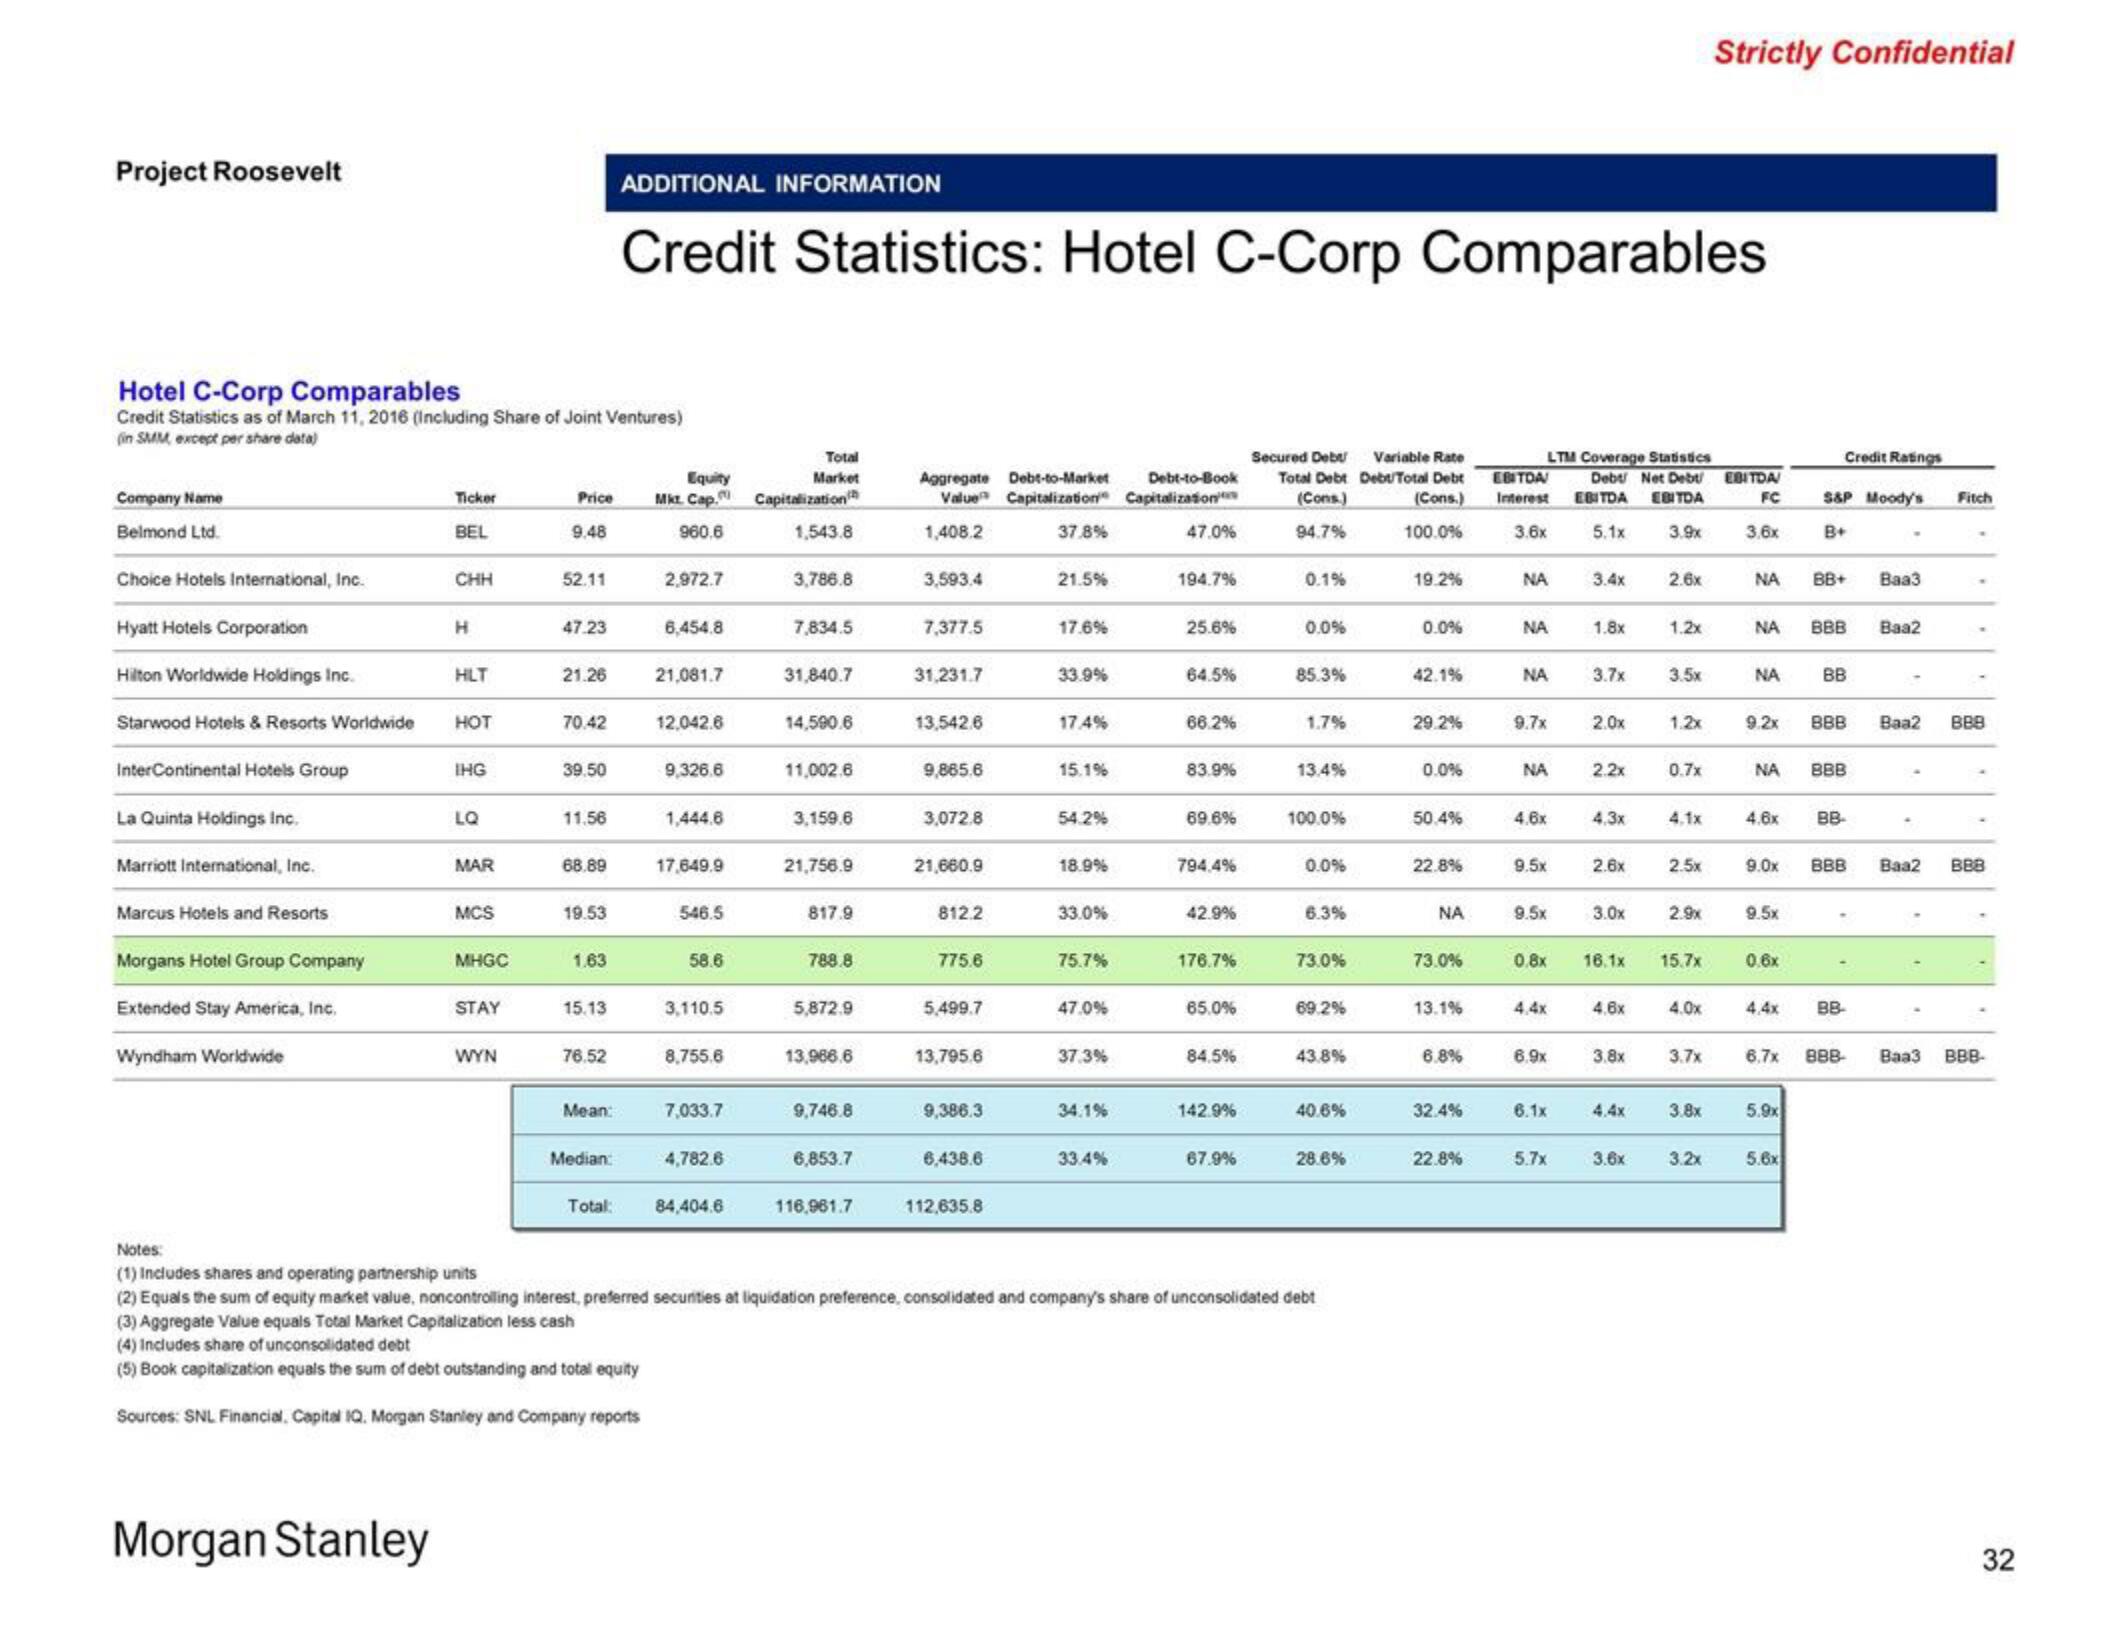
Hotel C-Corp Comparables
Credit Statistics as of March 11, 2016 (Including Share of Joint Ventures)
(in SMM, except per share data)
Company Name
Belmond Ltd.
Choice Hotels International, Inc.
Hyatt Hotels Corporation
Hilton Worldwide Holdings Inc.
Starwood Hotels & Resorts Worldwide
InterContinental Hotels Group
La Quinta Holdings Inc.
Marriott International, Inc.
Marcus Hotels and Resorts
Morgans Hotel Group Company
Extended Stay America, Inc.
Wyndham Worldwide
Ticker
Morgan Stanley
BEL
CHH
HLT
HOT
IHG
LQ
MAR
MCS
MHGC
STAY
WYN
Equity
Price Mkt. Cap.
960.6
9.48
52.11
47.23
21.26
70.42
39.50
11.56
68.89
19.53
1.63
15.13
76.52
Mean:
Median:
ADDITIONAL INFORMATION
Credit Statistics: Hotel C-Corp Comparables
Total:
2,972.7
6,454.8
21,081.7
12,042.6
9,326.6
1,444.6
17,649.9
546.5
58.6
3,110.5
8,755.6
7,033.7
4,782.6
84,404.6
Total
Market
Capitalization
1,543.8
3,786.8
7,834.5
31,840.7
14,590.6
11,002.6
3,159.6
21,756.9
817.9
788.8
5,872.9
13,966.6
9,746.8
6,853.7
116,961.7
Aggregate Debt-to-Market Debt-to-Book
Value Capitalization Capitalization
1,408.2
3,593.4
7,377.5
31,231.7
13,542.6
9,865.6
3,072.8
21,660.9
812.2
775.6
5,499.7
13,795.6
9,386.3
6,438.6
112,635.8
37.8%
21.5%
17.6%
33.9%
17.4%
15.1%
54.2%
18.9%
33.0%
75.7%
47.0%
37.3%
34.1%
33.4%
47.0%
194.7%
25.6%
64.5%
66.2%
83.9%
69.6%
794.4%
42.9%
176.7%
65.0%
84.5%
142.9%
67.9%
Secured Debu Variable Rate
Total Debt Debt/Total Debt
(Cons.)
(Cons.)
94.7%
100.0%
0.1%
0.0%
85.3%
1.7%
13.4%
100.0%
0.0%
6.3%
73.0%
69.2%
43.8%
40.6%
28.6%
Notes:
(1) Includes shares and operating partnership units
(2) Equals the sum of equity market value, noncontrolling interest, preferred securities at liquidation preference, consolidated and company's share of unconsolidated debt
(3) Aggregate Value equals Total Market Capitalization less cash
(4) Includes share of unconsolidated debt
(5) Book capitalization equals the sum of debt outstanding and total equity
Sources: SNL Financial, Capital IQ. Morgan Stanley and Company reports
19.2%
0.0%
42.1%
29.2%
0.0%
50.4%
22.8%
NA
73.0%
13.1%
6.8%
32.4%
22.8%
LTM Coverage Statistics
EBITDA Debt Net Debt
Interest EBITDA EBITDA
3.6x
5.1x
3.9x
ΝΑ
NA
ΝΑ
9.7x
NA
4,6x
9.5x
9.5x
4.4x
6.9x
6.1x
3.4x
5.7x
1.8x
2.0x
3.7x 3.5x
2.2x
0.8x 16.1x
4.3x
2.6x
3.0x
4.6x
3.8x
4.4x
2.6x
3.6x
1.2x
1.2x
0.7x
4.1x
2.5x
2.9x
15.7x
4.0x
3.7x
3.8x
Strictly Confidential
3.2x
EBITDA
FC
3.6x
ΝΑ BB+ Baa3
ΝΑ BBB Baa2
9.2x
NA BB
4.6x
ΝΑ BBB
9.5x
S&P Moody's
B+
0.6x
Credit Ratings
4.4x
5.9x
BBB
9.0x BBB Baa2 BBB
5.6x
BB
BB
6.7x 888-
Fitch
Baa2 BBB
Baa3 BBB-
32View entire presentation