Telia Company Results Presentation Deck
OPERATIONAL FREE CASH FLOW
16
14 12 10
●
8
6
4
2
Q1 19
Operational free cash flow trend
Reported currency, SEK billion, R12
Q3 19
Q1 20
Operational free cash flow (R12)
12.8
Q3 20
Q1 21
Ex NWC contr.
8.8
- Minimum dividend level
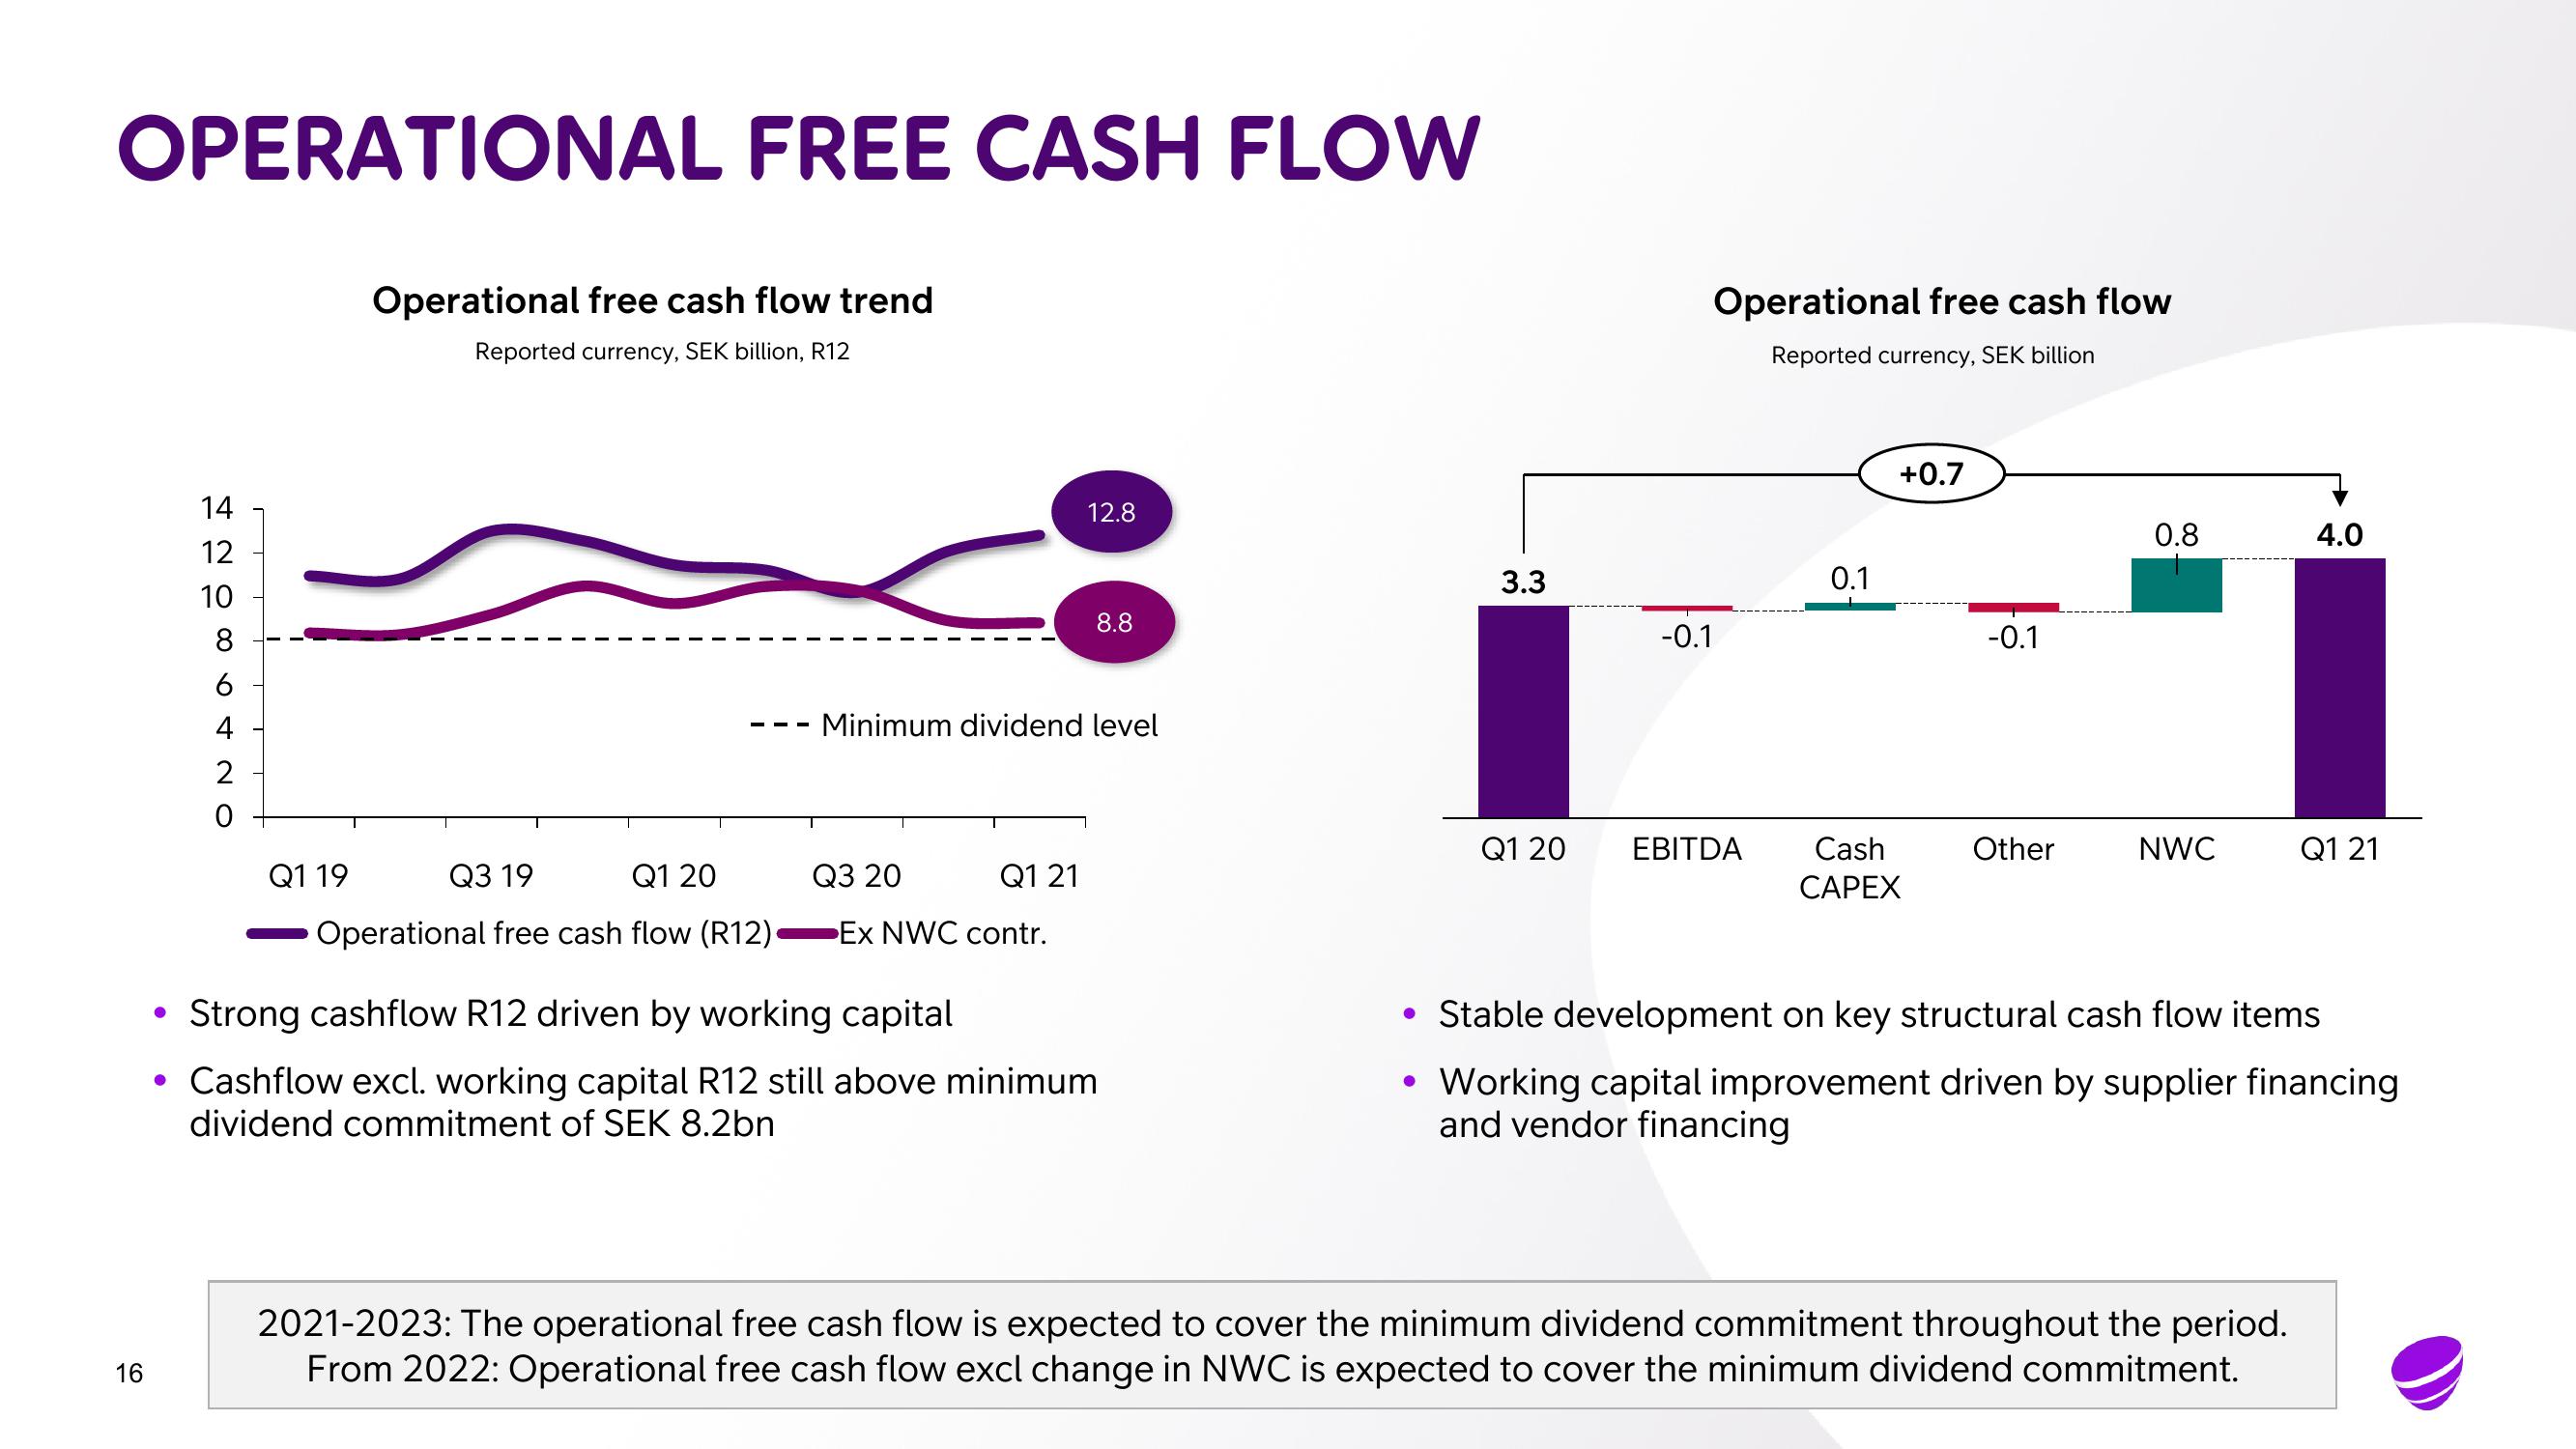
Strong cashflow R12 driven by working capital
• Cashflow excl. working capital R12 still above minimum
dividend commitment of SEK 8.2bn
3.3
●
-0.1
Operational free cash flow
Reported currency, SEK billion
Q1 20 EBITDA
0.1
Cash
CAPEX
+0.7
-0.1
Other
0.8
NWC
4.0
• Stable development on key structural cash flow items
Working capital improvement driven by supplier financing
and vendor financing
2021-2023: The operational free cash flow is expected to cover the minimum dividend commitment throughout the period.
From 2022: Operational free cash flow excl change in NWC is expected to cover the minimum dividend commitment.
Q1 21View entire presentation