Barclays Credit Presentation Deck
STRATEGY, TARGETS
& GUIDANCE
Income
£3.5bn
Q420: £3.5bn
Cost: income
ratio
66%
Q420: 68%
Loan loss rate
7bps
Q420: 90bps
ROTE
10.4%
Q420: 5.8%
PERFORMANCE
Q421 Barclays International
ROTE of 10.4% driven by resilient income and operating performance
Total assets
£1,044bn
Sep-21:
£1,076bn
Costs
£2.3bn
Q420: £2.4bn
Impairment
£23m
Q420: £291m
PBT
£1.2bn
Q420: £0.8bn
Average
equity¹
£32.9bn
Q420: £30.5bn
RWAS
£230.9bn
Sep-21:
£222.7bn
●
24 | Barclays Q4 2021 Results | 23 February 2022
ASSET QUALITY
●
CAPITAL
& LEVERAGE
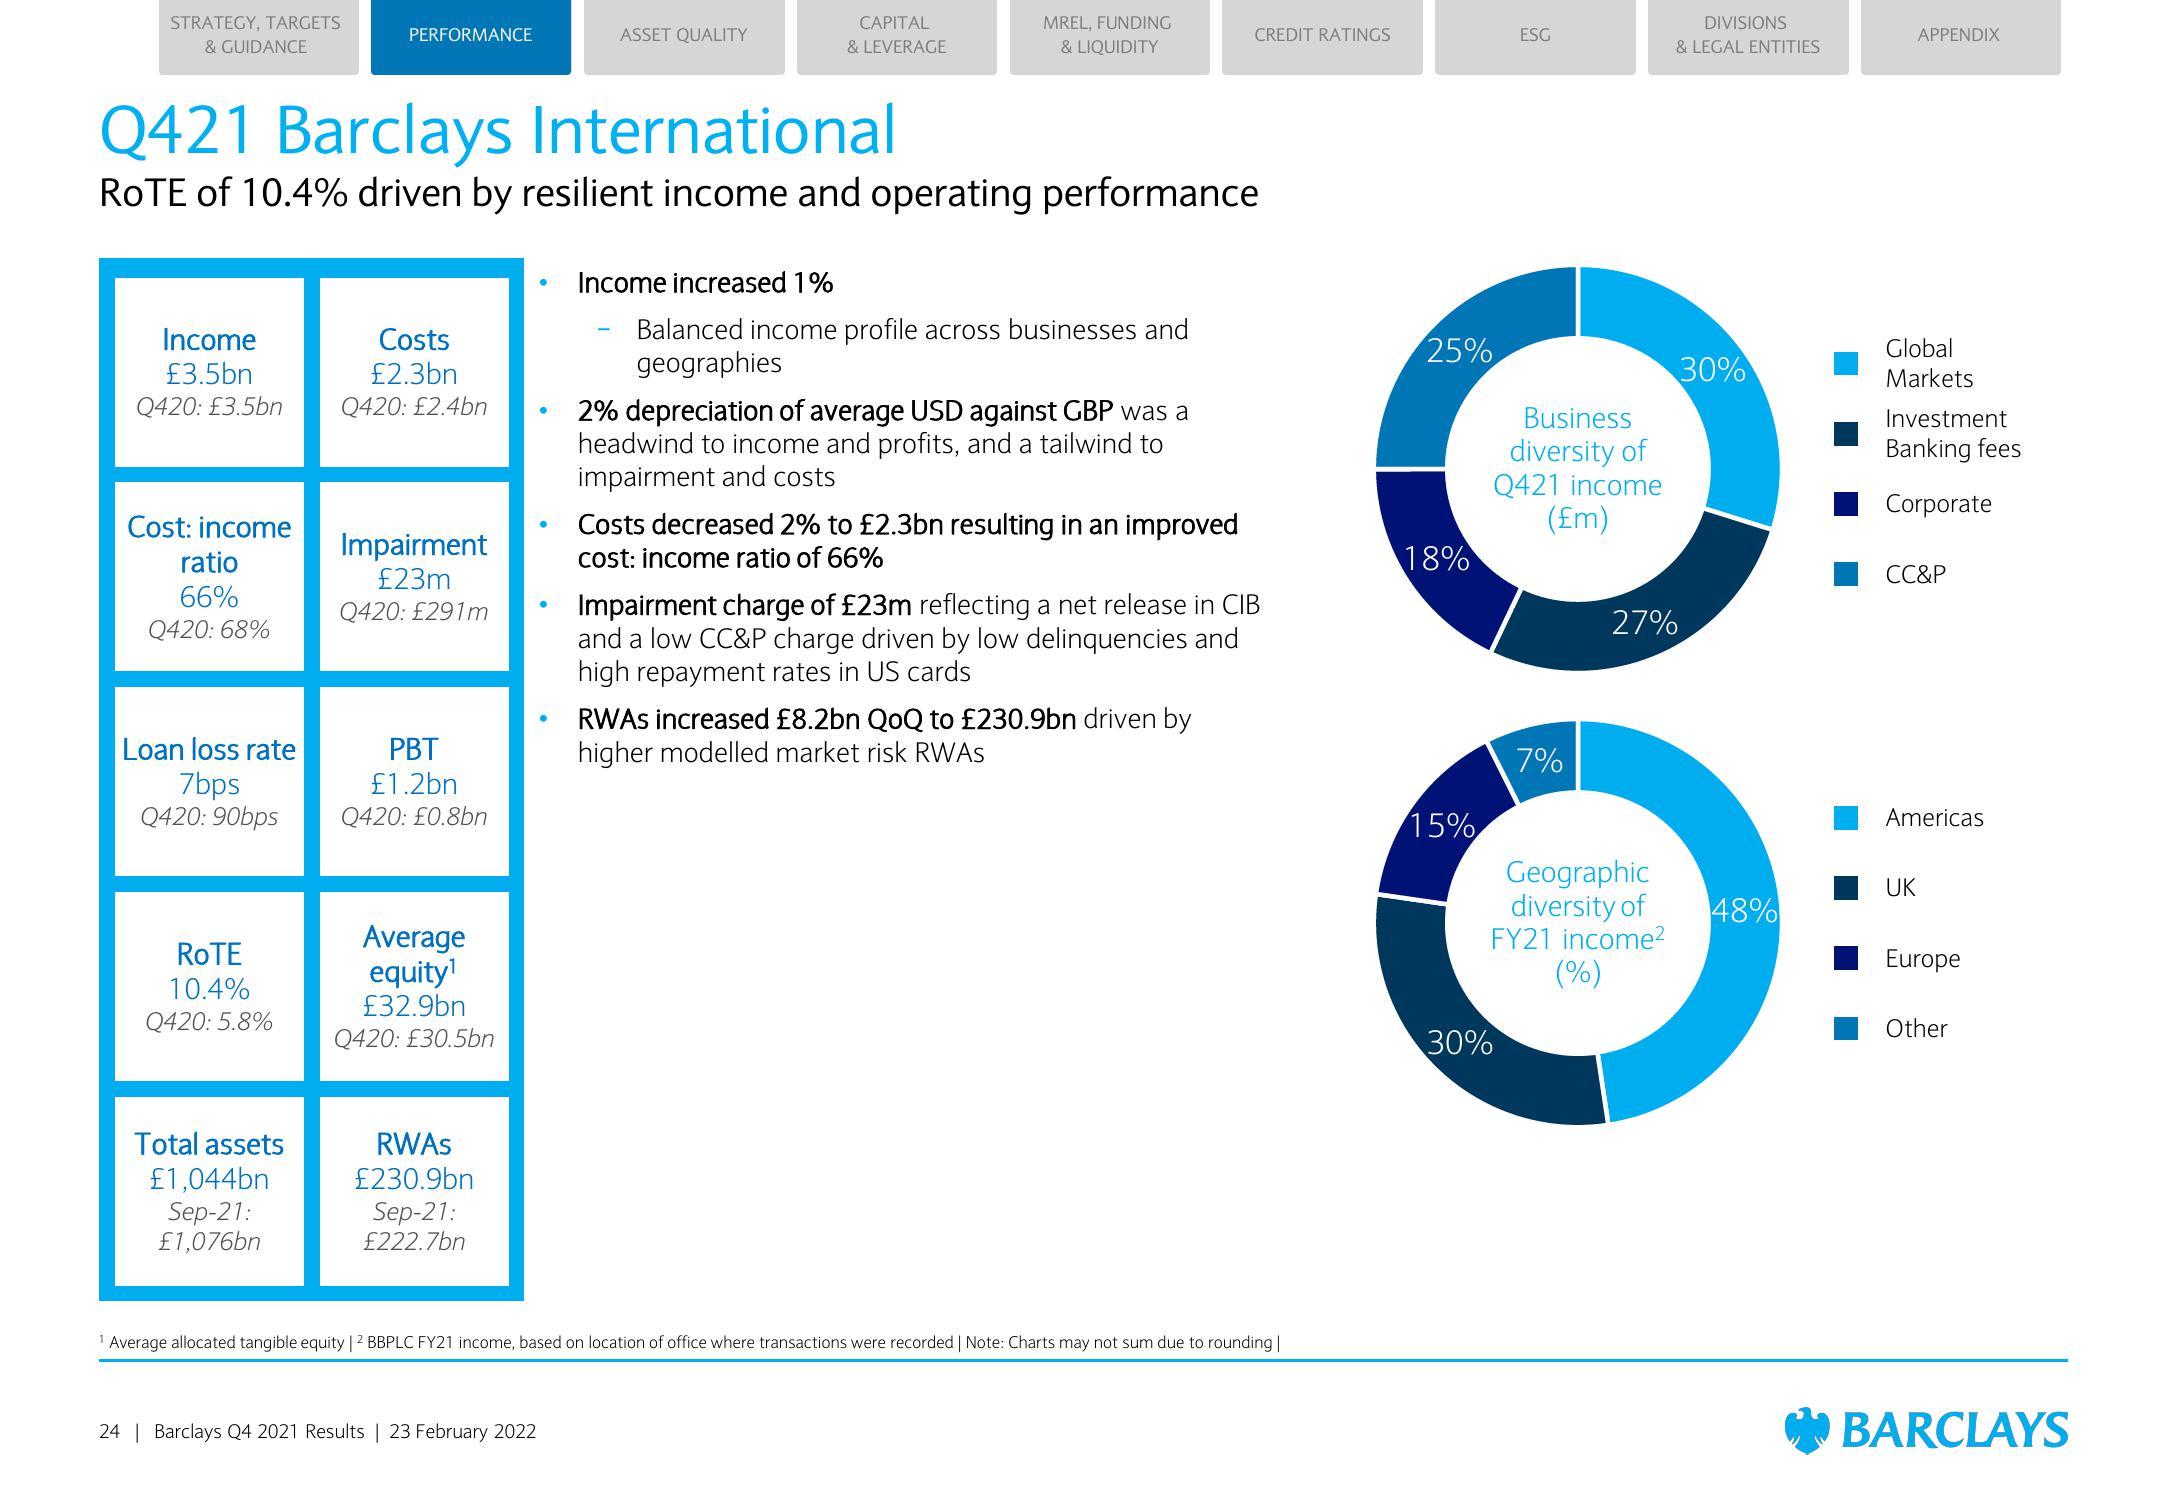
Income increased 1%
MREL, FUNDING
& LIQUIDITY
Balanced income profile across businesses and
geographies
2% depreciation of average USD against GBP was a
headwind to income and profits, and a tailwind to
impairment and costs
Costs decreased 2% to £2.3bn resulting in an improved
cost: income ratio of 66%
CREDIT RATINGS
Impairment charge of £23m reflecting a net release in CIB
and a low CC&P charge driven by low delinquencies and
high repayment rates in US cards
RWAS increased £8.2bn QoQ to £230.9bn driven by
higher modelled market risk RWAS
Average allocated tangible equity | ² BBPLC FY21 income, based on location of office where transactions were recorded | Note: Charts may not sum due to rounding |
25%
18%
15%
30%
ESG
Business
diversity of
Q421 income
(£m)
7%
DIVISIONS
& LEGAL ENTITIES
27%
Geographic
diversity of
FY21 income²
(%)
30%
48%
APPENDIX
Global
Markets
Investment
Banking fees
Corporate
CC&P
Americas
UK
Europe
Other
BARCLAYSView entire presentation