Cyxtera Results Presentation Deck
Capital Expenditures
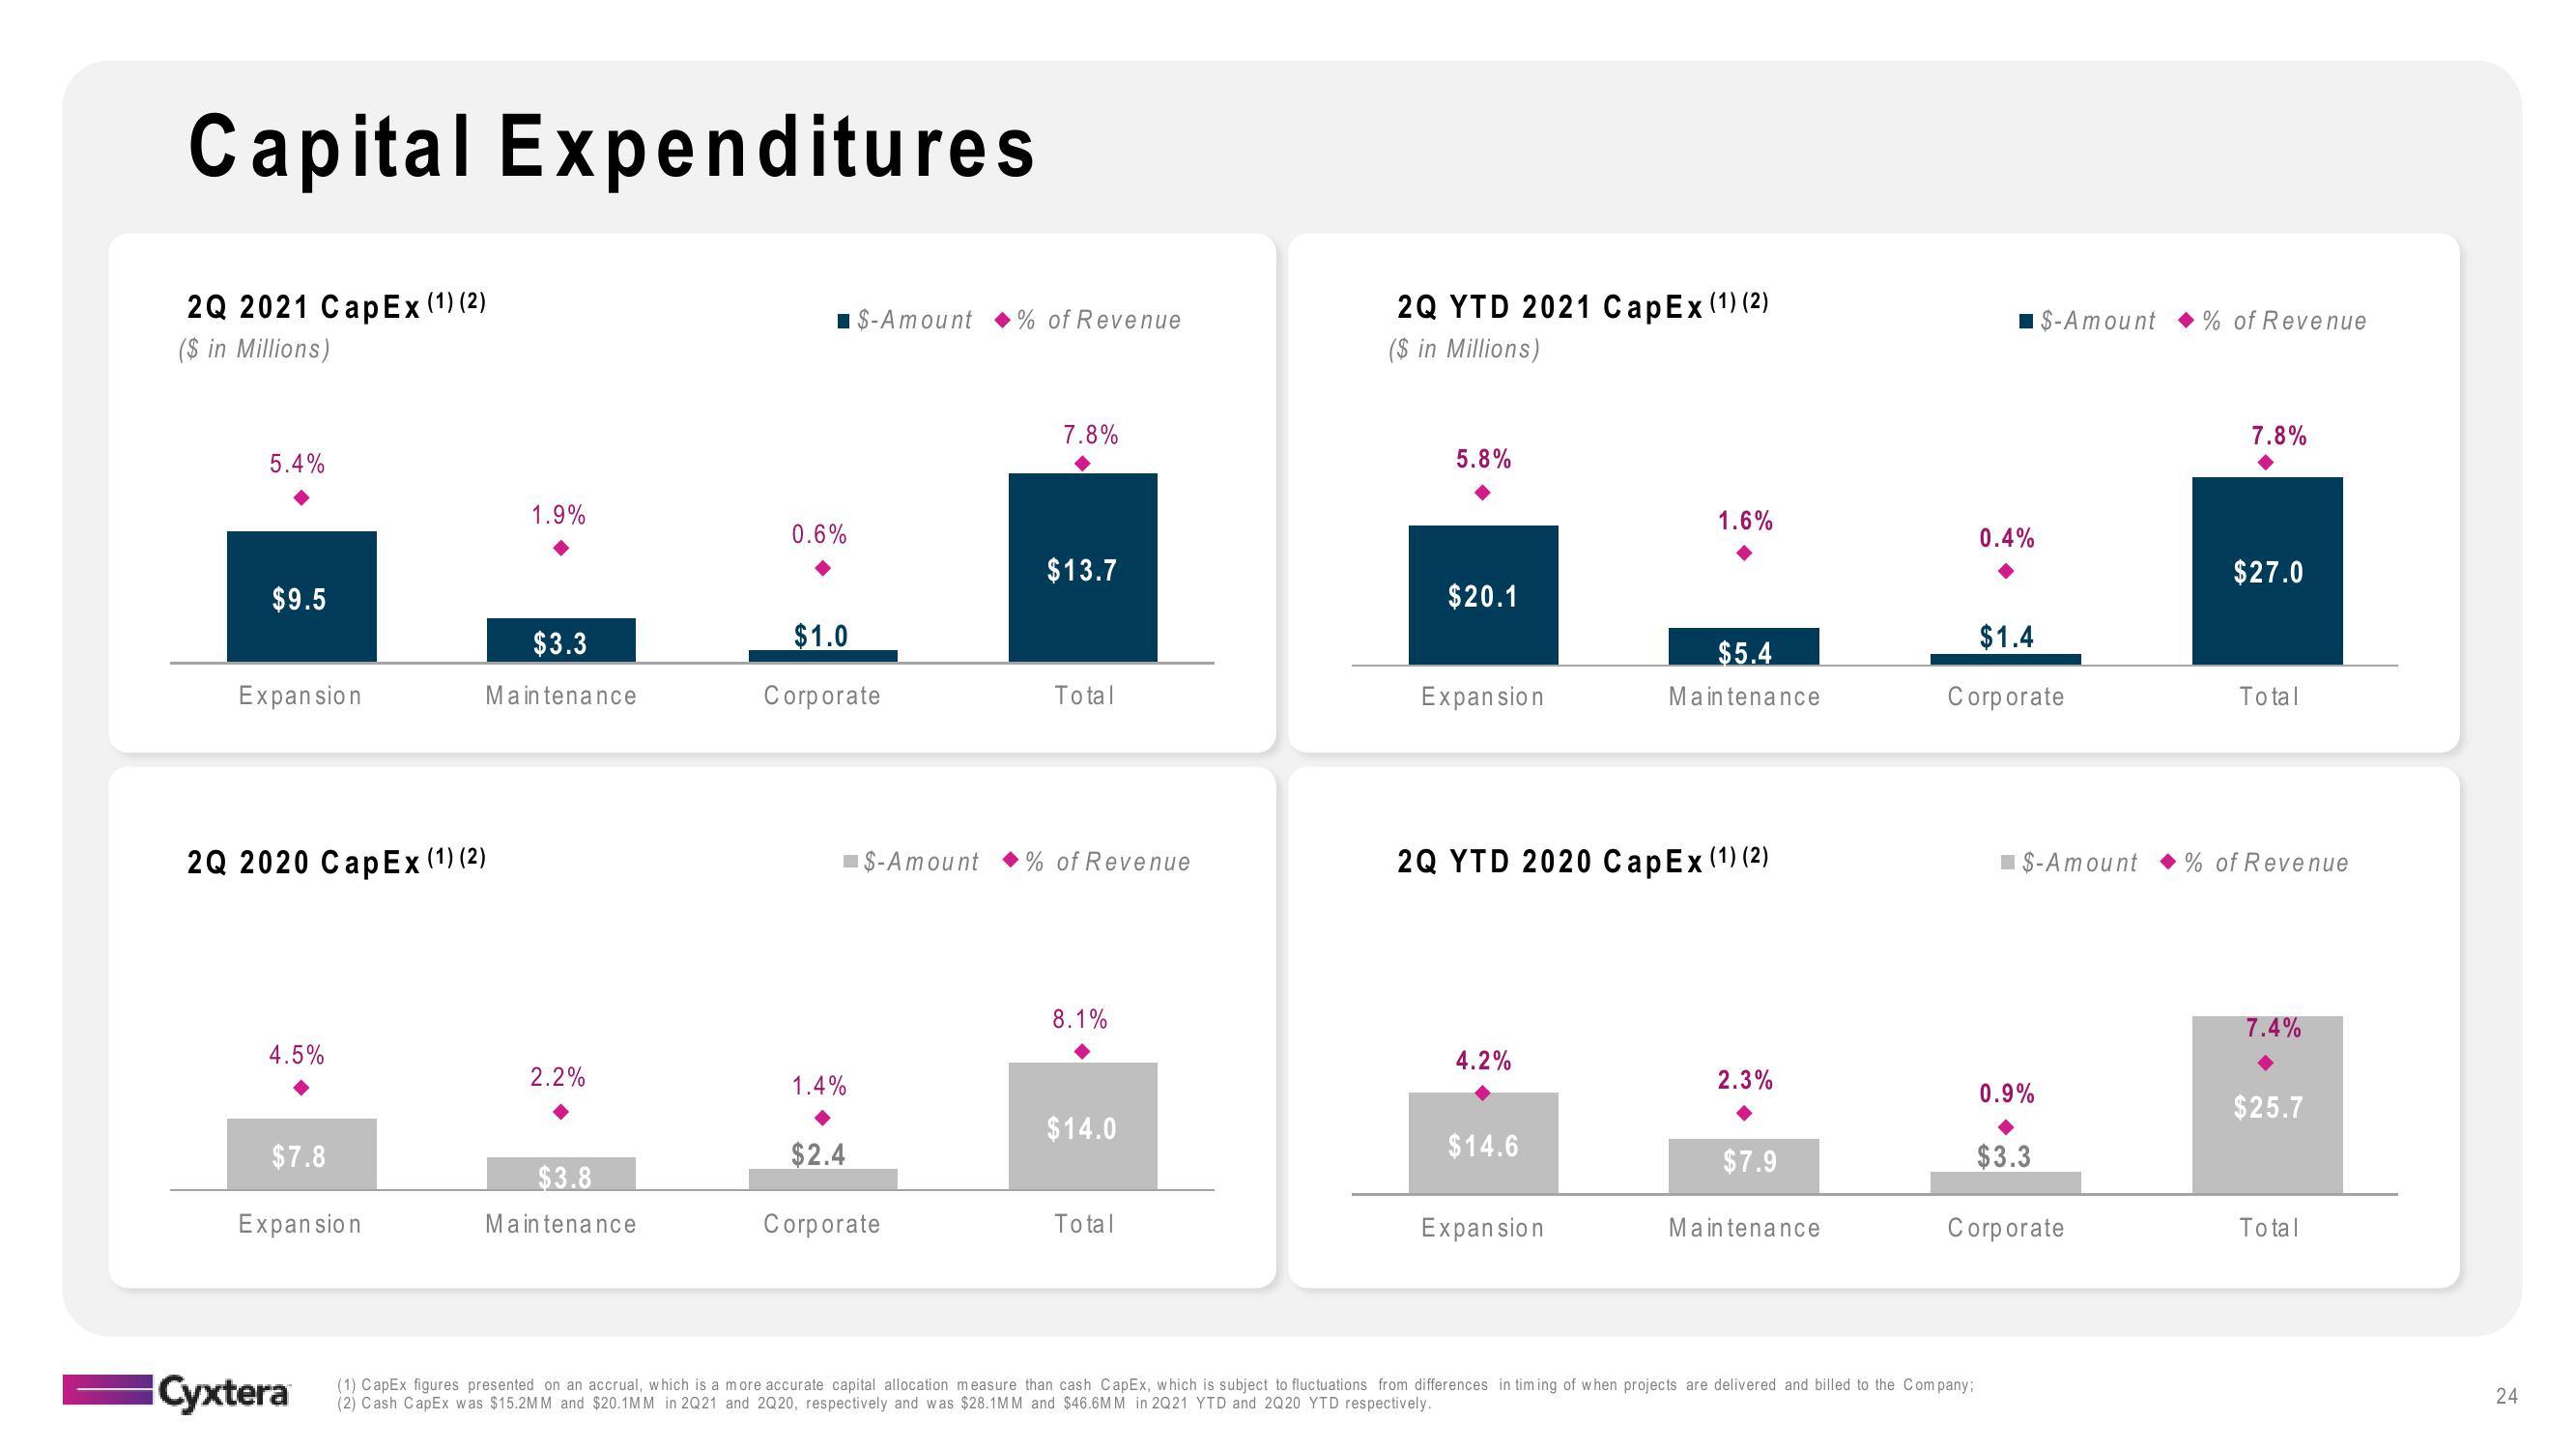
2Q 2021 CapEx (1) (2)
($ in Millions)
5.4%
$9.5
Expansion
2Q 2020 CapEx (1) (2)
4.5%
$7.8
Expansion
Cyxtera
1.9%
$3.3
Maintenance
2.2%
$3.8
Maintenance
■ $-Amount % of Revenue
0.6%
$1.0
Corporate
1.4%
7.8%
$2.4
Corporate
$13.7
Total
$-Amount % of Revenue
8.1%
$14.0
Total
2Q YTD 2021 CapEx (1) (2)
($ in Millions)
5.8%
$20.1
Expansion
4.2%
2Q YTD 2020 CapEx (1) (2)
$14.6
1.6%
Expansion
$5.4
Maintenance
2.3%
$7.9
Maintenance
0.4%
$1.4
Corporate
(1) CapEx figures presented on an accrual, which is a more accurate capital allocation measure than cash CapEx, which is subject to fluctuations from differences in timing of when projects are delivered and billed to the Company;
(2) Cash CapEx was $15.2MM and $20.1MM in 2Q21 and 2Q20, respectively and was $28.1MM and $46.6MM in 2Q21 YTD and 2Q20 YTD respectively.
$-Amount
■$-Amount
0.9%
$3.3
Corporate
% of Revenue
7.8%
$27.0
Total
% of Revenue
7.4%
$25.7
Total
24View entire presentation