Paysafe Results Presentation Deck
Q2 financial highlights
Volume¹ (sbn)
$32.3
Q2 2021
+3%
$33.4
Q2 2022
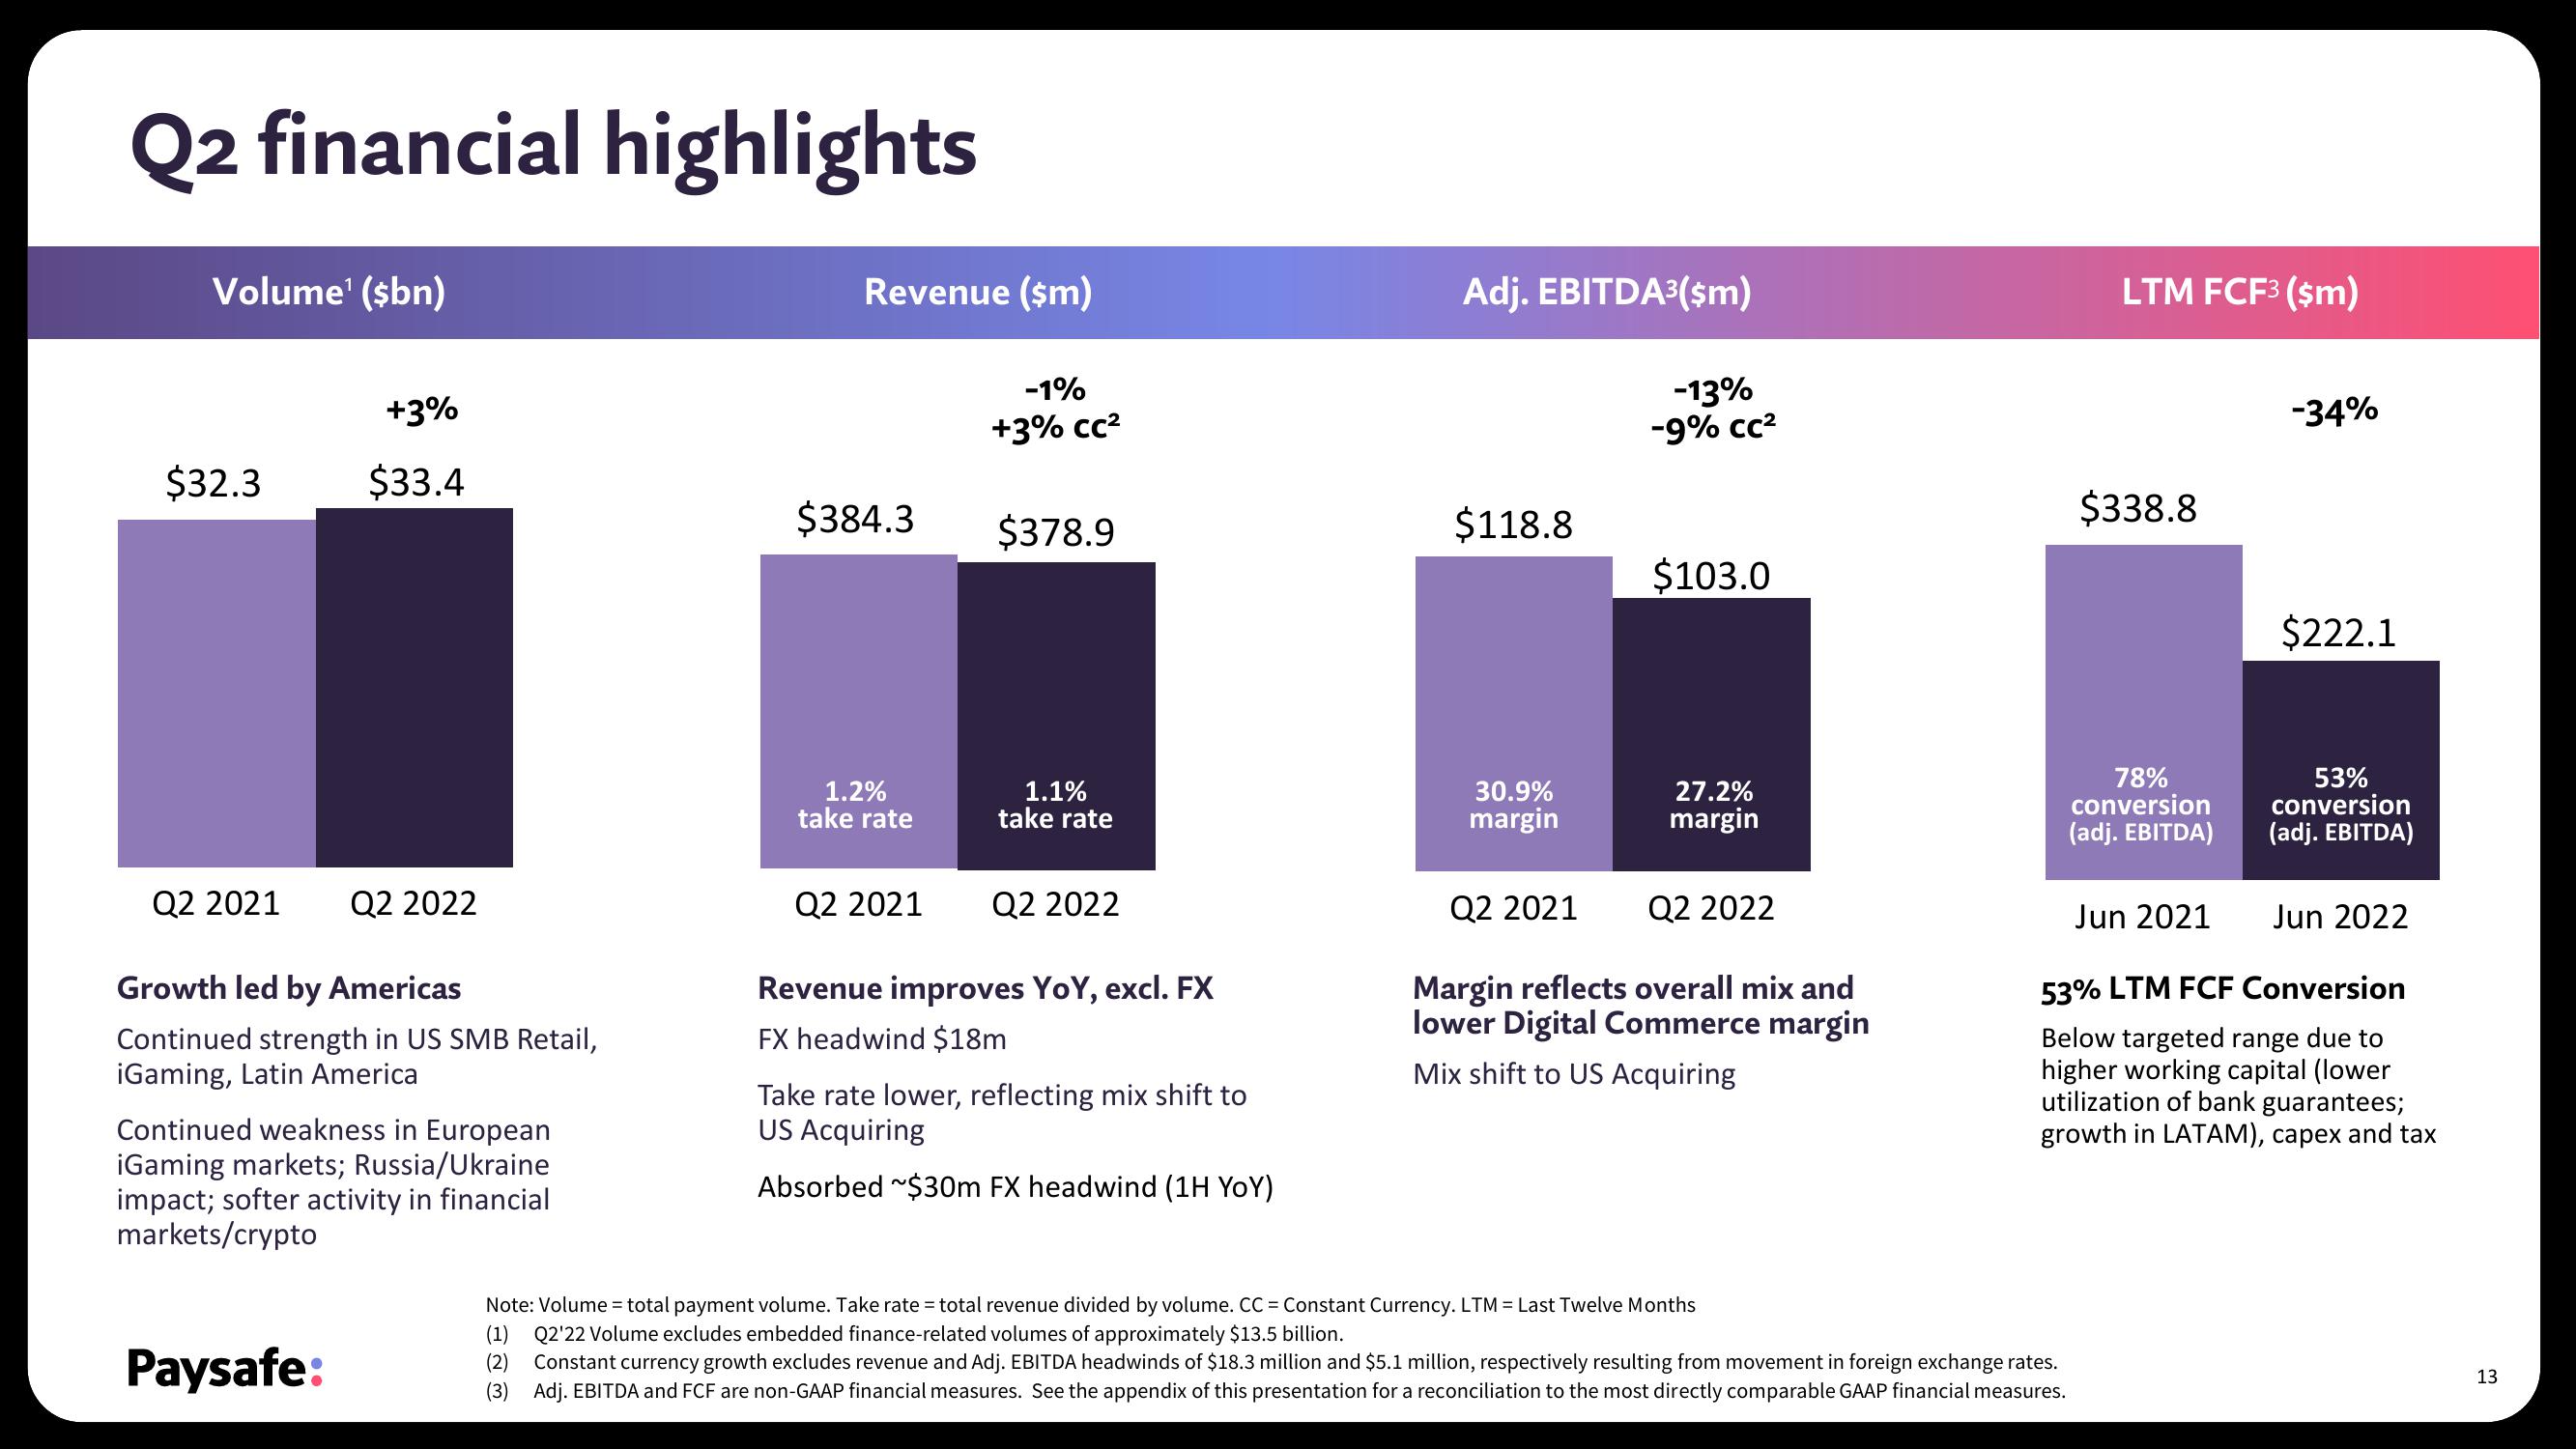
Growth led by Americas
Continued strength in US SMB Retail,
iGaming, Latin America
Paysafe:
Continued weakness in European
iGaming markets; Russia/Ukraine
impact; softer activity in financial
markets/crypto
Revenue ($m)
$384.3
1.2%
take rate
Q2 2021
-1%
+3% cc²
$378.9
1.1%
take rate
Q2 2022
Revenue improves YoY, excl. FX
FX headwind $18m
Take rate lower, reflecting mix shift to
US Acquiring
Absorbed ~$30m FX headwind (1H YoY)
Adj. EBITDA³($m)
$118.8
30.9%
margin
Q2 2021
-13%
-9% CC²
$103.0
27.2%
margin
Q2 2022
Margin reflects overall mix and
lower Digital Commerce margin
Mix shift to US Acquiring
LTM FCF³ ($m)
Note: Volume = total payment volume. Take rate = total revenue divided by volume. CC = Constant Currency. LTM = Last Twelve Months
(1) Q2'22 Volume excludes embedded finance-related volumes of approximately $13.5 billion.
(2) Constant currency growth excludes revenue and Adj. EBITDA headwinds of $18.3 million and $5.1 million, respectively resulting from movement in foreign exchange rates.
(3) Adj. EBITDA and FCF are non-GAAP financial measures. See the appendix of this presentation for a reconciliation to the most directly comparable GAAP financial measures.
$338.8
78%
conversion
(adj. EBITDA)
Jun 2021
-34%
$222.1
53%
conversion
(adj. EBITDA)
Jun 2022
53% LTM FCF Conversion
Below targeted range due to
higher working capital (lower
utilization of bank guarantees;
growth in LATAM), capex and tax
13View entire presentation