Maersk Investor Presentation Deck slide image

Maersk Investor Presentation Deck

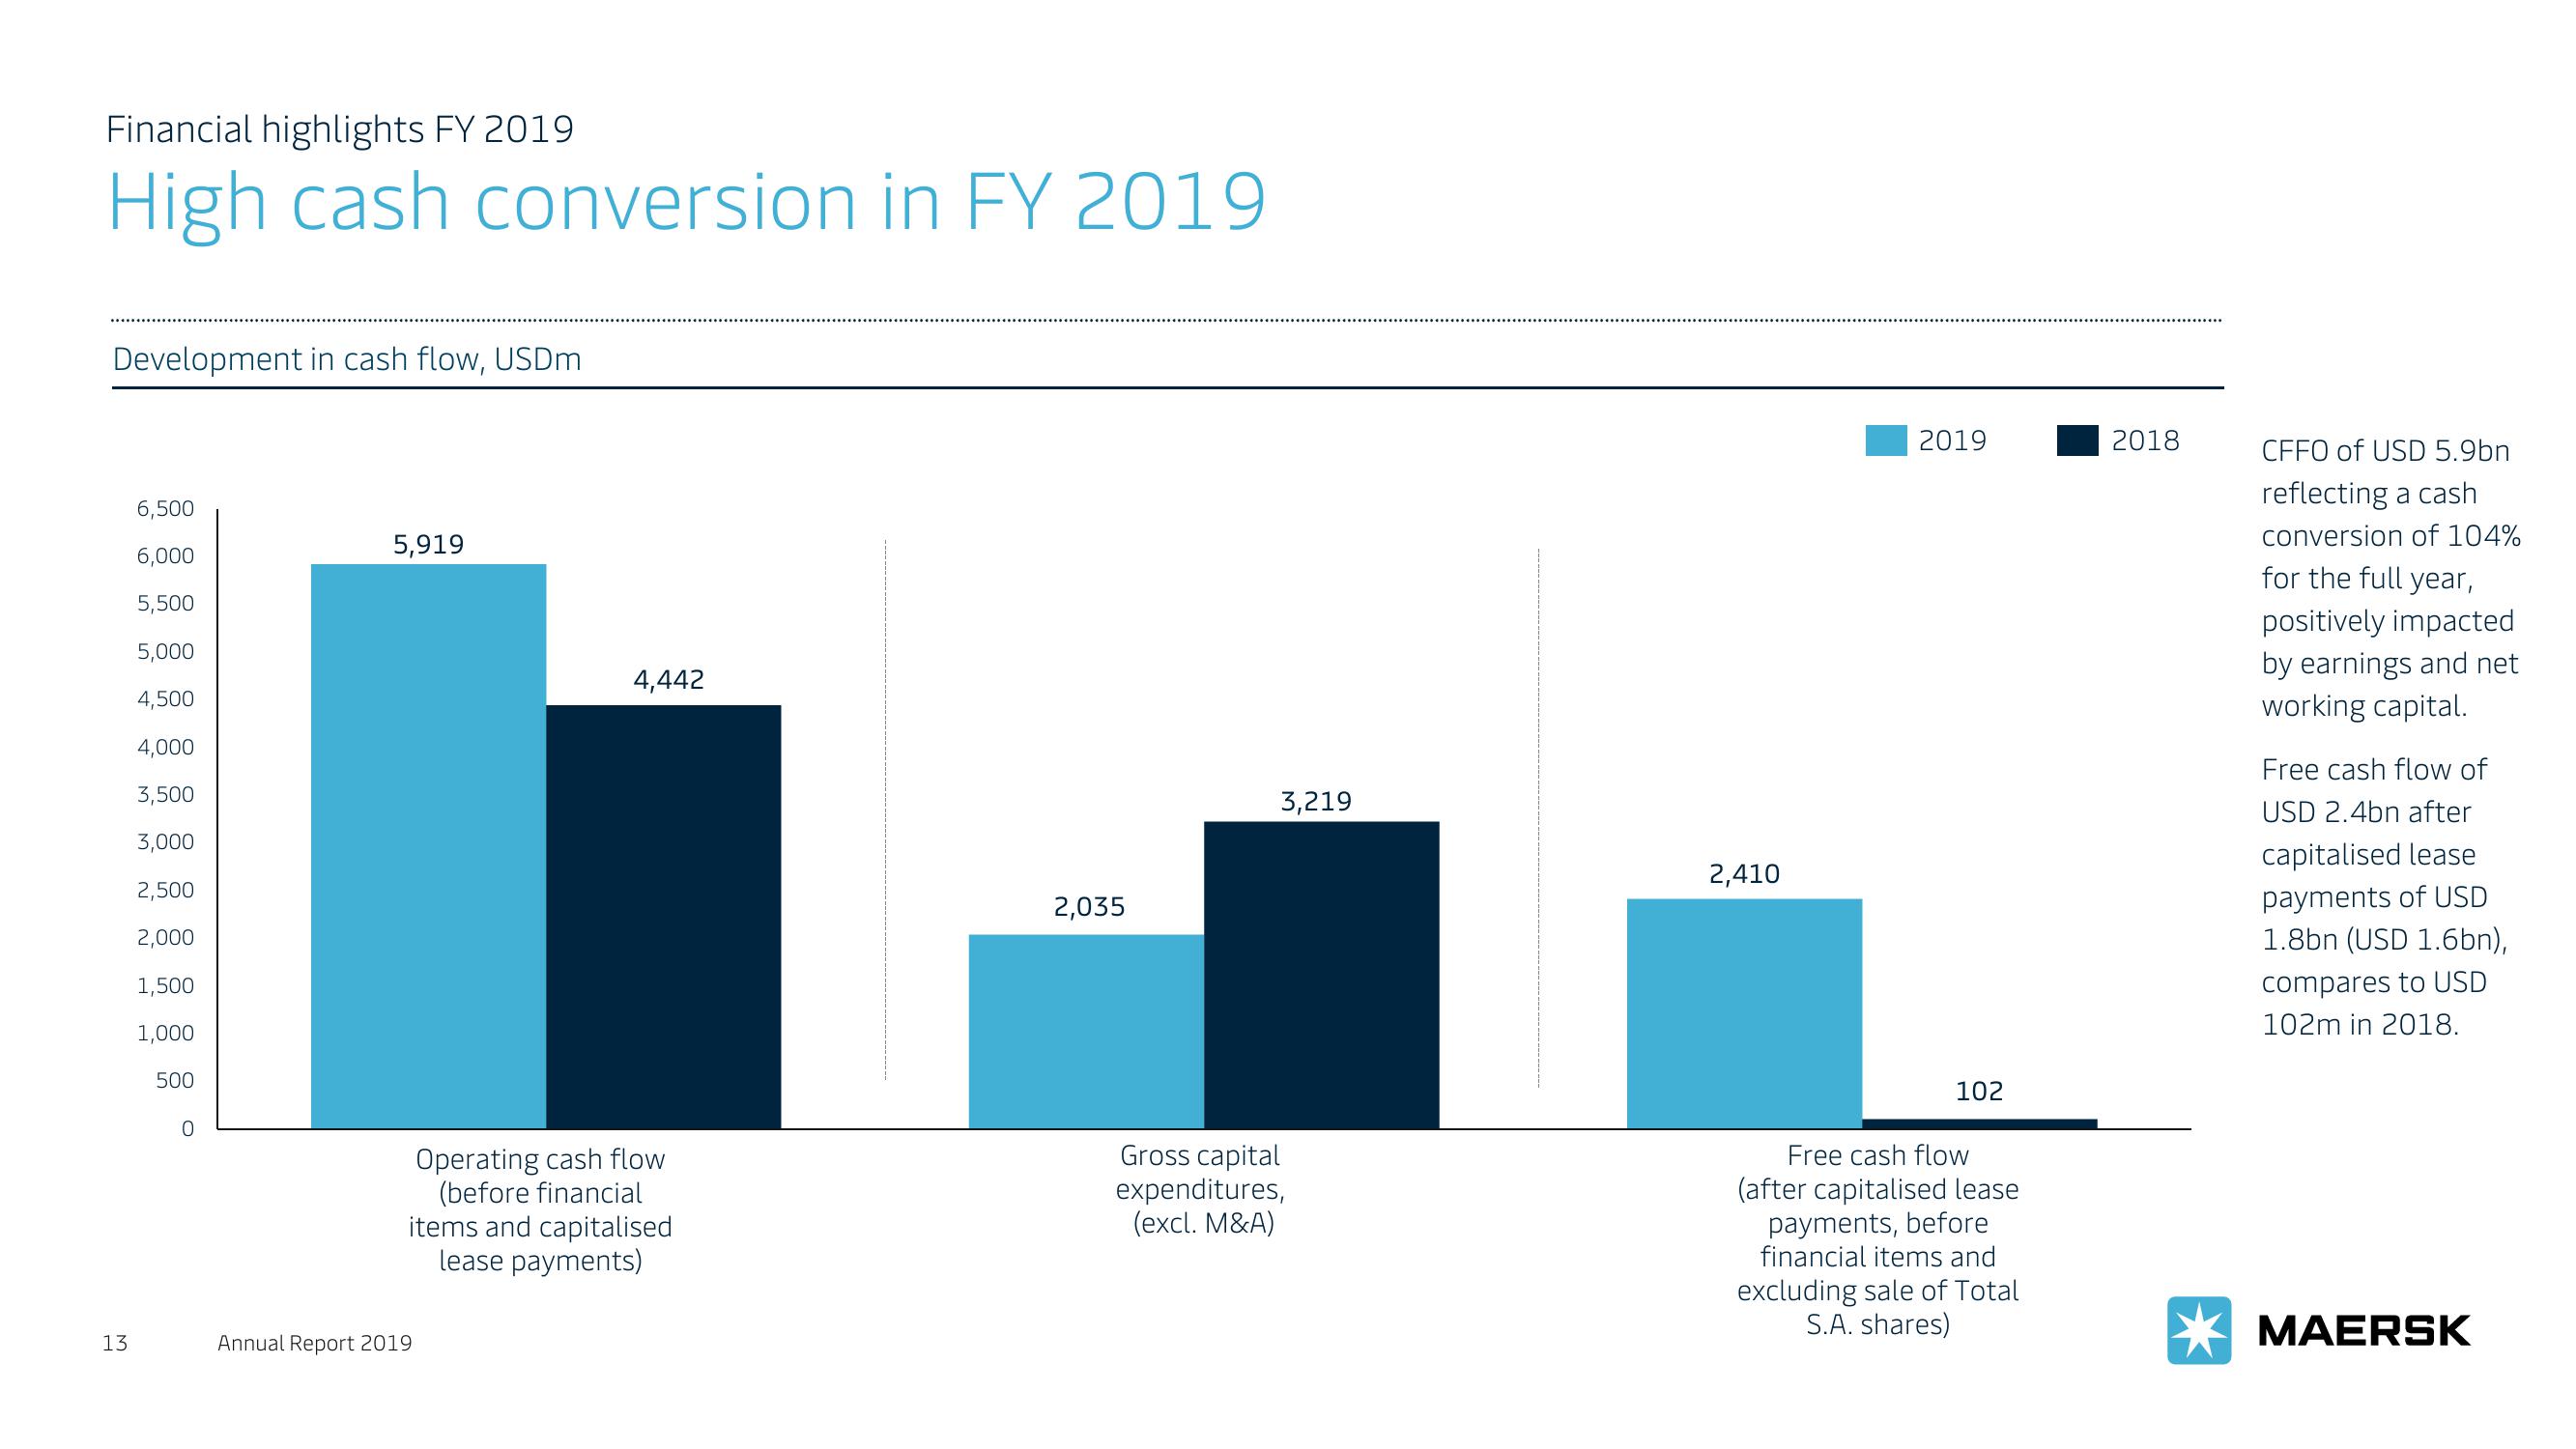
Financial highlights FY 2019 High cash conversion in FY 2019 Development in cash flow, USDm 13 6,500 6,000 5,500 5,000 4,500 4,000 3,500 3,000 2,500 2,000 1,500 1,000 500 0 5,919 4,442 Operating cash flow (before financial items and capitalised lease payments) Annual Report 2019 2,035 3,219 Gross capital expenditures, (excl. M&A) 2,410 2019 102 Free cash flow (after capitalised lease payments, before financial items and excluding sale of Total S.A. shares) 2018 CFFO of USD 5.9bn reflecting a cash conversion of 104% for the full year, positively impacted by earnings and net working capital. Free cash flow of USD 2.4bn after capitalised lease payments of USD 1.8bn (USD 1.6bn), compares to USD 102m in 2018. MAERSK
View entire presentation