Nexters Results Presentation Deck
Key financial highlights (1/2)
$m
Revenue
74
+65%
Q4 2020 Q4 2021
6
123
$m
Net Income/ Loss
+75%
11
261
+66%
FY 2020
-0,7
434
FY 2021
>100%
FY 2020
-124
FY 2021
$m
Operating Cash Flow
41
$m
+5%
Q4 2020 Q4 2021
44
Adjusted Net Income/ Loss (1)
>100%
24
Q4 2020 Q4 2021
121
FY 2020
1,5
-13%
>100%
FY 2020
106
FY 2021
5
FY 2021
Q4 2020 Q4 2021
Source: Company information (preliminary and unaudited)
8 1) The Company defines Adjusted Net Income/Loss as the Net Income/Loss as presented in the Company's financial statements in accordance with IFRS, adjusted to exclude (i) share-based compensation expense, (ii)
impairment of non-current assets, (iii) any gains and losses arising as result of business combinations (including the amortisation of intangible assets acquired in the business combinations and transaction costs related to
the business combinations) and (iv) certain non-cash or other special items that we do not consider indicative of our ongoing operating performance. Adjusted net income is a non-IFRS financial measure and should not be
construed as an alternative to Net Income/ Loss as an indicator of operating performance as determined in accordance with IFRS
nexters
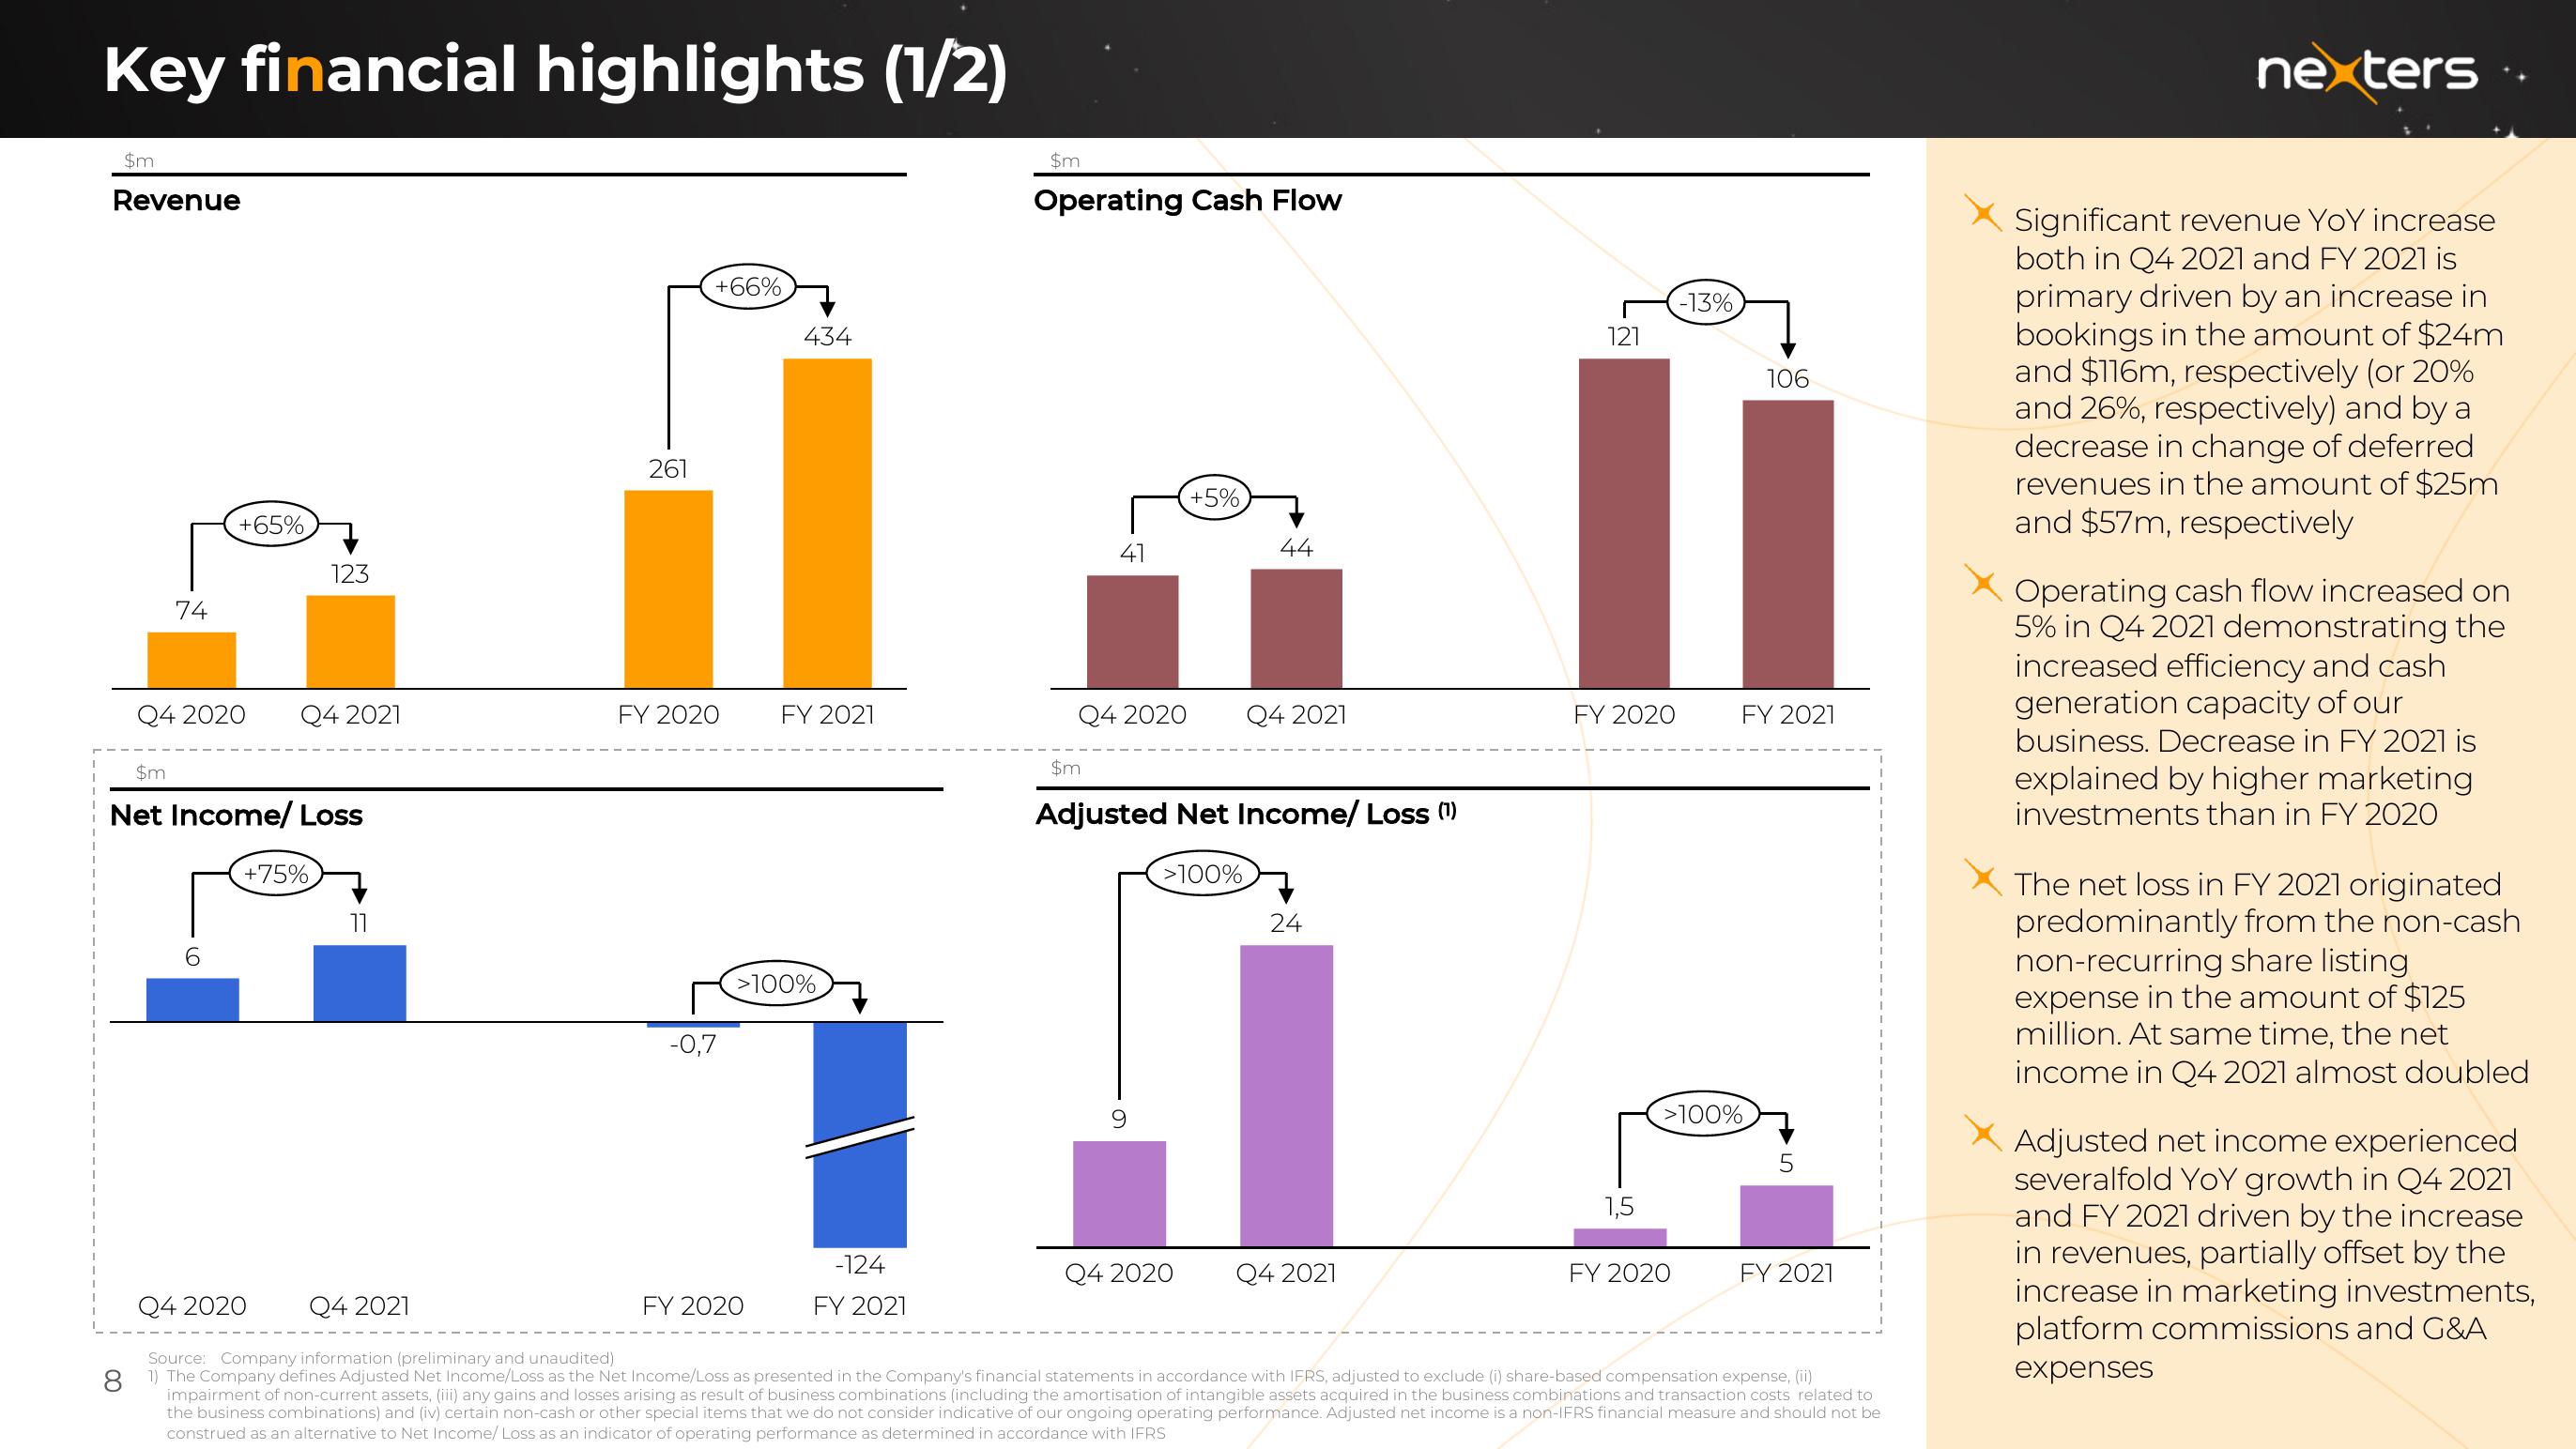
Significant revenue YoY increase
both in Q4 2021 and FY 2021 is
primary driven by an increase in
bookings in the amount of $24m
and $116m, respectively (or 20%
and 26%, respectively) and by a
decrease in change of deferred
revenues in the amount of $25m
and $57m, respectively
Operating cash flow increased on
5% in Q4 2021 demonstrating the
increased efficiency and cash
generation capacity of our
business. Decrease in FY 2021 is
explained by higher marketing
investments than in FY 2020
The net loss in FY 2021 originated
predominantly from the non-cash
non-recurring share listing
expense in the amount of $125
million. At same time, the net
income in Q4 2021 almost doubled
Adjusted net income experienced
severalfold YoY growth in Q4 2021
and FY 2021 driven by the increase
in revenues, partially offset by the
increase in marketing investments,
platform commissions and G&A
expensesView entire presentation