Frontier IPO Presentation Deck
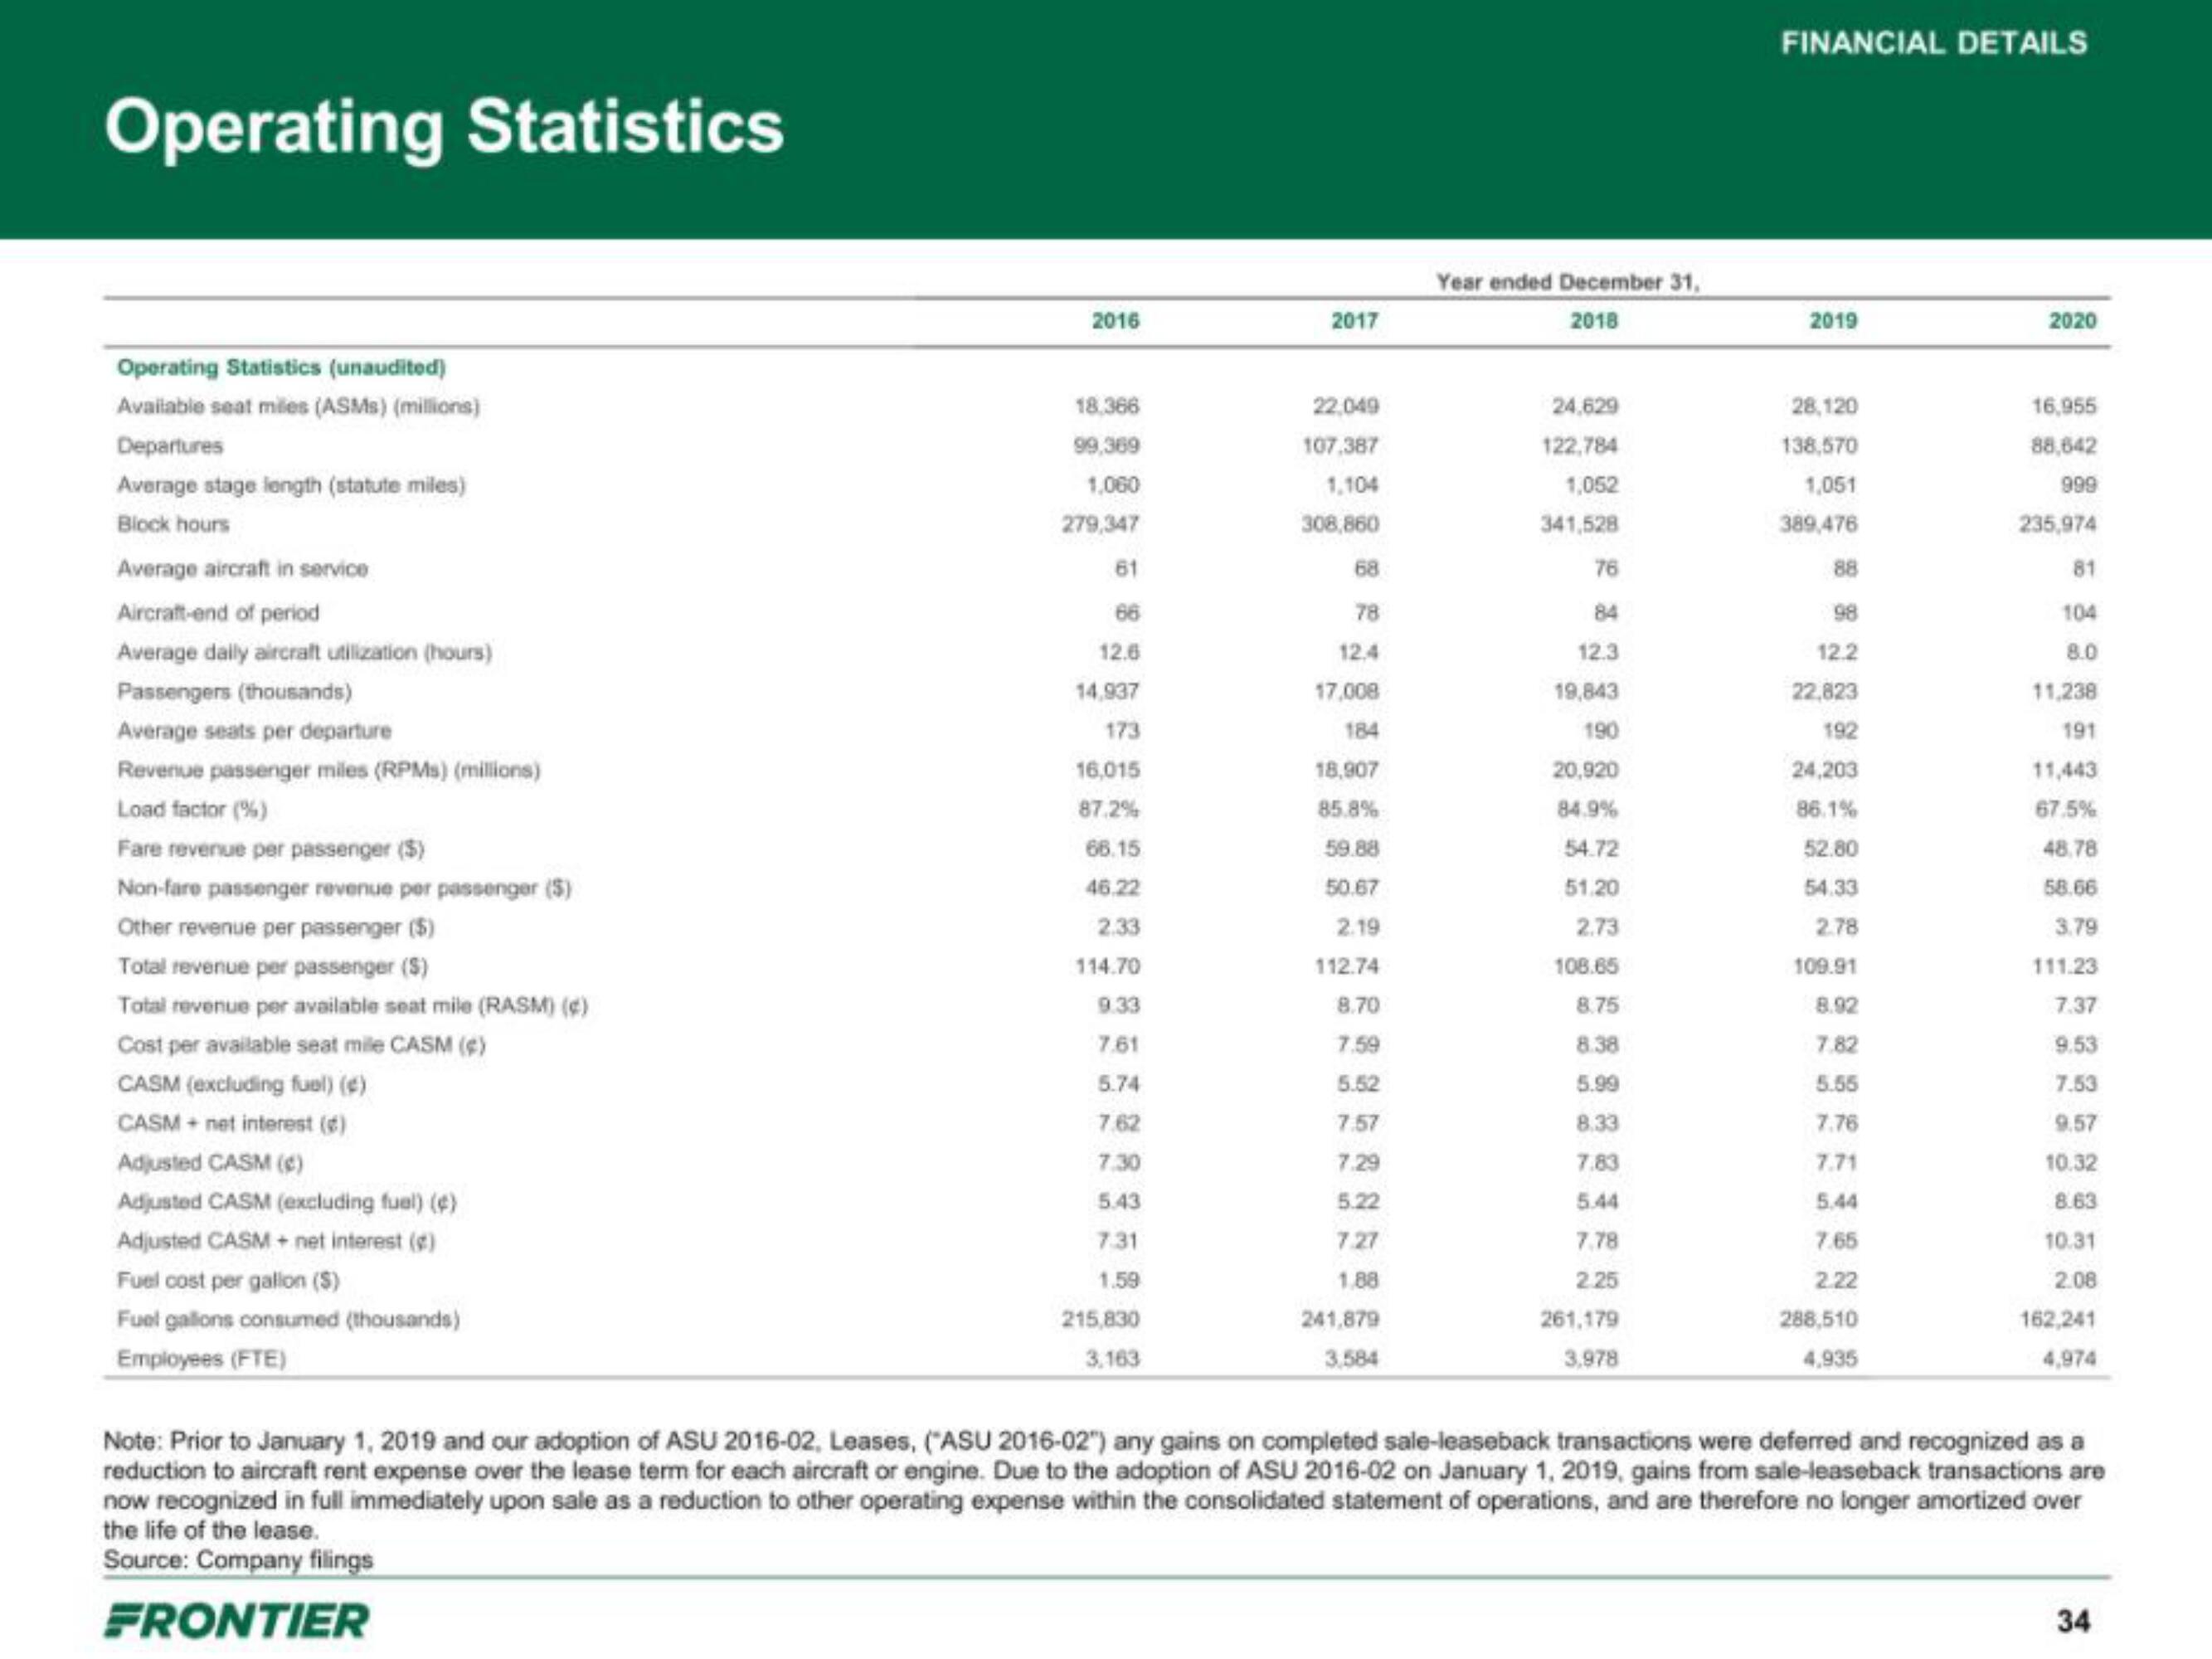
Operating Statistics
Operating Statistics (unaudited)
Available seat miles (ASMs) (millions)
Departures
Average stage length (statute miles)
Block hours
Average aircraft in service
Aircraft-end of period
Average daily aircraft utilization (hours)
Passengers (thousands)
Average seats per departure
Revenue passenger miles (RPMs) (millions)
Load factor (%)
Fare revenue per passenger ($)
Non-fare passenger revenue per passenger ($)
Other revenue per passenger ($)
Total revenue per passenger (S)
Total revenue per available seat mile (RASM) (*)
Cost per available seat mile CASM ($)
CASM (excluding fuel) (c)
CASM + net interest (d)
Adjusted CASM (4)
Adjusted CASM (excluding fuel) (c)
Adjusted CASM + net interest (g)
Fuel cost per gallon ($)
Fuel gallons consumed (thousands)
Employees (FTE)
2016
18.366
99,369
1,060
279,347
61
66
12.6
14,937
173
16,015
87.2%
66.15
46.22
2.33
114.70
9.33
7.61
5.74
7.62
7.30
5.43
7.31
1.59
215,830
3.163
2017
22,049
107,387
1,104
308,860
68
78
12.4
17,008
184
18,907
85.8%
59.88
50.67
2.19
112.74
8.70
7.59
5.52
7.57
7.29
5.22
7.27
1.88
241,879
3,584
Year ended December 31,
2018
24,629
122,784
1,052
341,528
76
84
12.3
19,843
190
20,920
84.9%
54.72
51.20
2.73
108.65
8.75
8.38
5.99
8.33
7.83
5.44
7.78
2.25
261,179
3,978
FINANCIAL DETAILS
2019
28,120
138,570
1,051
389,476
88
98
12.2
22,823
192
24,203
86.1%
52.80
54.33
2.78
109.91
8.92
7.82
5.55
7.76
7.71
5.44
7.65
2.22
288,510
4,935
2020
16,955
88,642
999
235,974
81
104
8.0
11,238
191
11,443
67.5%
48.78
58.66
3.79
111.23
7.37
9.53
7.53
9.57
10.32
8.63
10.31
2.08
162,241
4,974
Note: Prior to January 1, 2019 and our adoption of ASU 2016-02, Leases, ("ASU 2016-02") any gains on completed sale-leaseback transactions were deferred and recognized as a
reduction to aircraft rent expense over the lease term for each aircraft or engine. Due to the adoption of ASU 2016-02 on January 1, 2019, gains from sale-leaseback transactions are
now recognized in full immediately upon sale as a reduction to other operating expense within the consolidated statement of operations, and are therefore no longer amortized over
the life of the lease.
Source: Company filings
FRONTIER
34View entire presentation