FiscalNote Investor Presentation Deck
Q2 2023 Summary - Reconciliation to non-GAAP measures
Adjusted Revenues
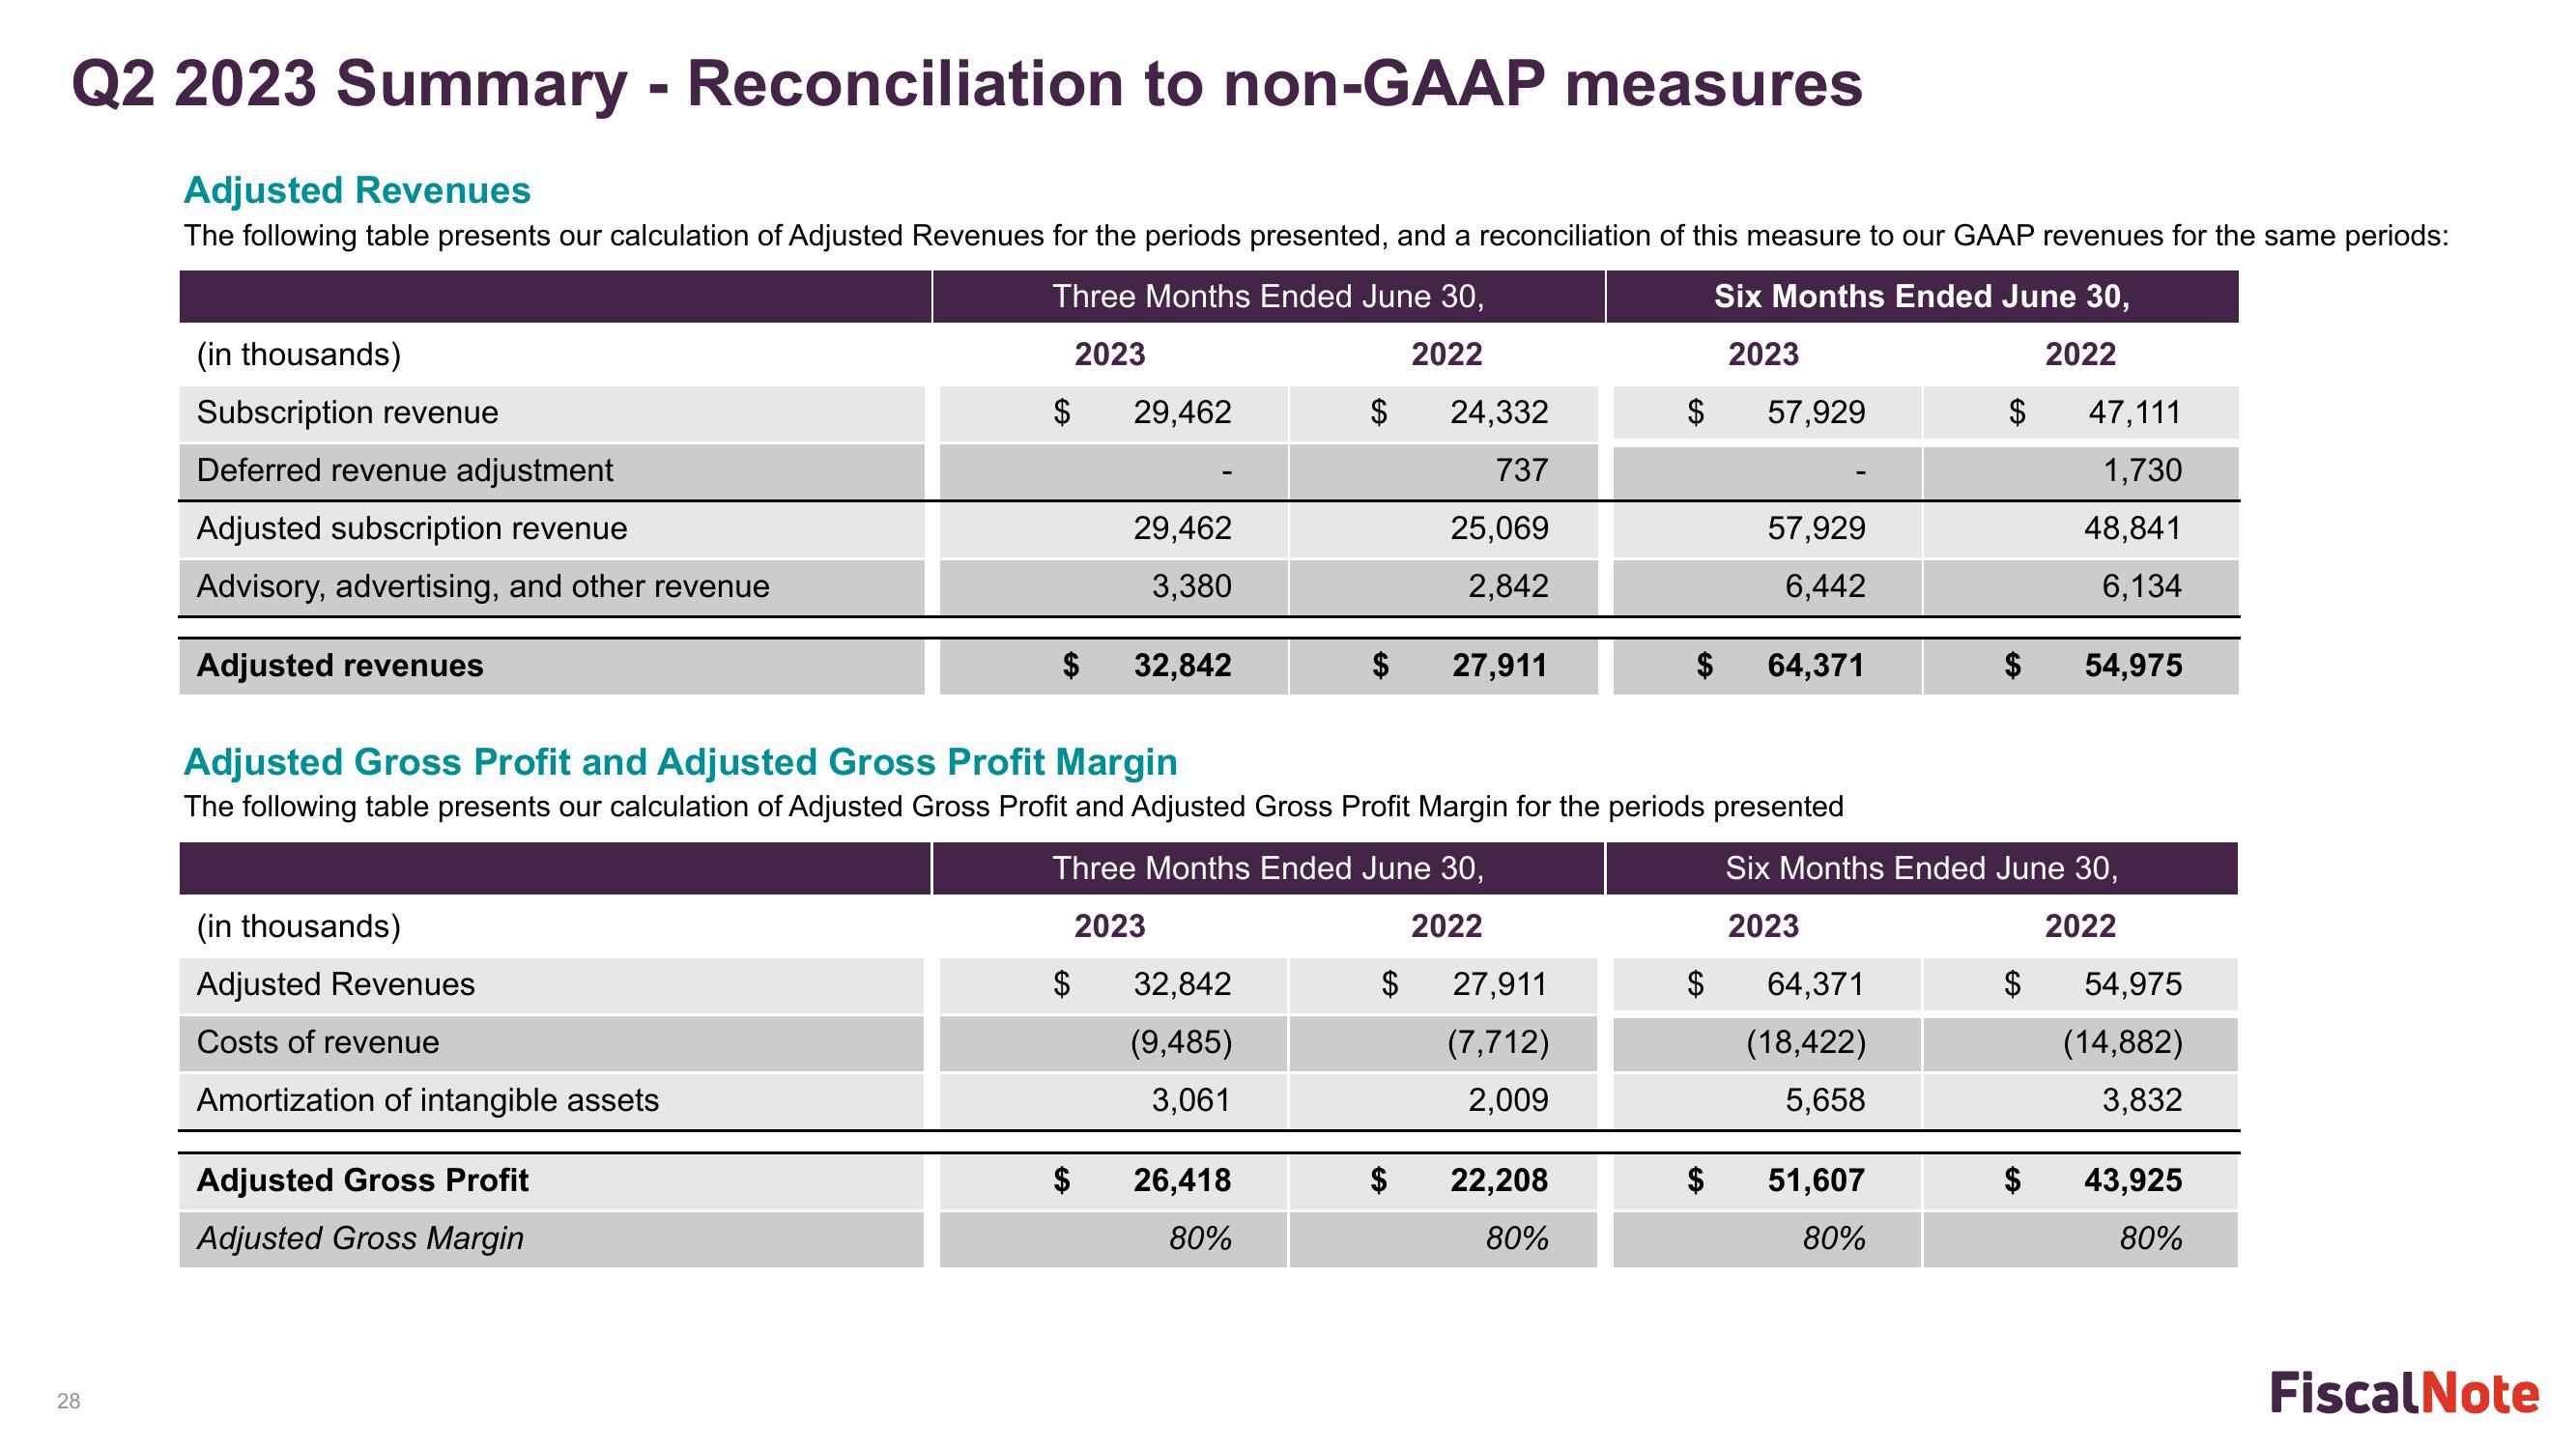
The following table presents our calculation of Adjusted Revenues for the periods presented, and a reconciliation of this measure to our GAAP revenues for the same periods:
Three Months Ended June 30,
Six Months Ended June 30,
2023
2022
2023
2022
28
(in thousands)
Subscription revenue
Deferred revenue adjustment
Adjusted subscription revenue
Advisory, advertising, and other revenue
Adjusted revenues
(in thousands)
Adjusted Revenues
Costs of revenue
Amortization of intangible assets
$
Adjusted Gross Profit
Adjusted Gross Margin
29,462
$
29,462
3,380
32,842
32,842
(9,485)
3,061
$
26,418
80%
24,332
737
25,069
2,842
Adjusted Gross Profit and Adjusted Gross Profit Margin
The following table presents our calculation of Adjusted Gross Profit and Adjusted Gross Profit Margin for the periods presented
Three Months Ended June 30,
2023
2022
$
27,911
27,911
(7,712)
2,009
$
22,208
80%
57,929
$
57,929
6,442
64,371
64,371
(18,422)
5,658
47,111
1,730
48,841
6,134
Six Months Ended June 30,
2023
2022
51,607
80%
54,975
54,975
(14,882)
3,832
43,925
80%
Fiscal NoteView entire presentation