Bank of America Results Presentation Deck
Global Banking
Summary Income Statement ($MM)
Total revenue, net of interest expense¹
Provision (benefit) for credit losses
Noninterest expense
Pretax income
Pretax, pre-provision income²
Income tax expense
Net income
Selected Revenue Items ($MM)
Total Corporation IB fees (excl. self-led)¹
Global Banking IB fees¹
Business Lending revenue
Global Transaction Services revenue³
Key Indicators ($B)
Average deposits
Average loans and leases
Net charge-off ratio
Net charge-offs ($MM)
Reserve build (release) ($MM)
Return on average allocated capital
Allocated capital
Efficiency ratio
3Q22
$5,591
170
2,651
2,770
2,940
734
$2,036
3Q22
$1,167
726
2,079
2,803
3Q22
$495.2
384.3
0.03 %
$26
144
18 %
$44.5
47 %
Inc / (Dec)
2Q22
$585
13
(148)
720
733
191
$529
2Q22
$1,128
692
2,032
2,381
2Q22
$509.3
377.2
0.01 %
$14
143
14 %
$44.5
56 %
3Q21
$346
951
117
(722)
229
(209)
($513)
3Q21
$2,168
1,297
1,862
1,945
3Q21
$534.2
324.7
0.01 %
$8
(789)
24 %
$42.5
48 %
.
.
.
.
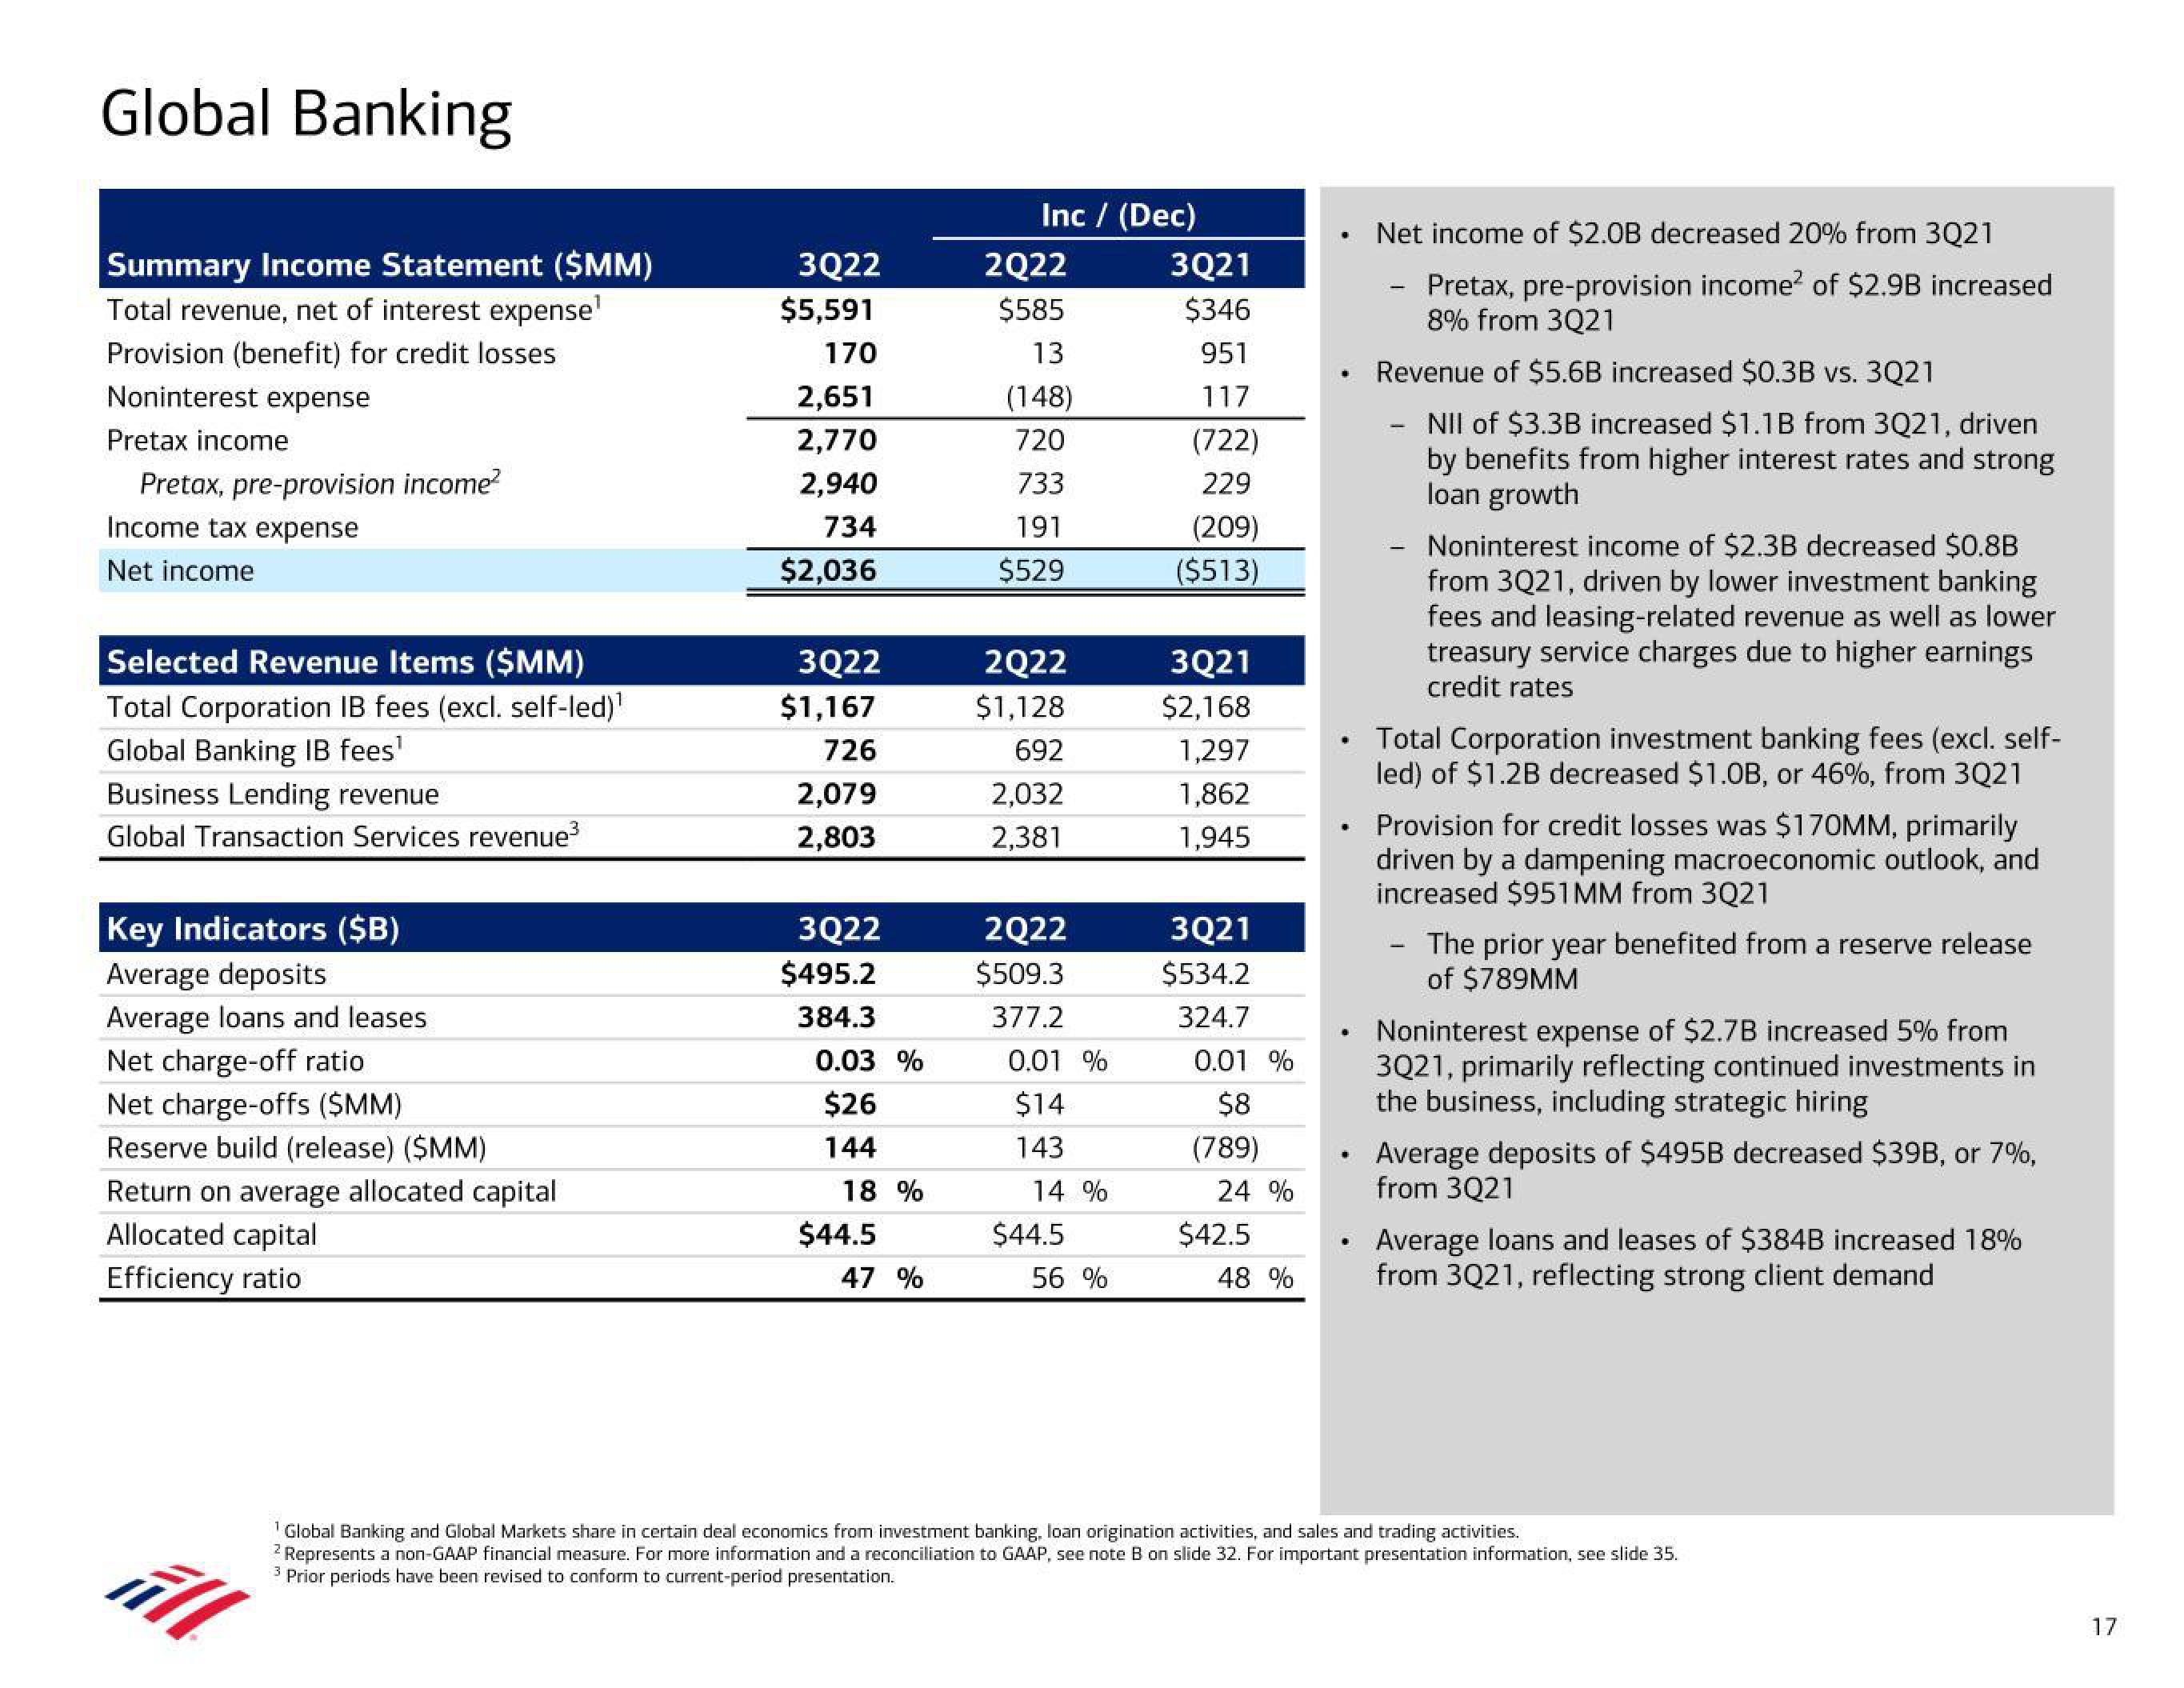
Net income of $2.0B decreased 20% from 3Q21
Pretax, pre-provision income2 of $2.9B increased
8% from 3Q21
Revenue of $5.6B increased $0.3B vs. 3Q21
NII of $3.3B increased $1.1B from 3Q21, driven
by benefits from higher interest rates and strong
loan growth
Noninterest income of $2.3B decreased $0.8B
from 3Q21, driven by lower investment banking
fees and leasing-related revenue as well as lower
treasury service charges due to higher earnings
credit rates
Total Corporation investment banking fees (excl. self-
led) of $1.2B decreased $1.0B, or 46%, from 3Q21
Provision for credit losses was $170MM, primarily
driven by a dampening macroeconomic outlook, and
increased $951MM from 3Q21
The prior year benefited from a reserve release
of $789MM
Noninterest expense of $2.7B increased 5% from
3Q21, primarily reflecting continued investments in
the business, including strategic hiring
Average deposits of $495B decreased $39B, or 7%,
from 3Q21
Average loans and leases of $384B increased 18%
from 3Q21, reflecting strong client demand
Global Banking and Global Markets share in certain deal economics from investment banking, loan origination activities, and sales and trading activities.
² Represents a non-GAAP financial measure. For more information and a reconciliation to GAAP, see note B on slide 32. For important presentation information, see slide 35.
3 Prior periods have been revised to conform to current-period presentation.
All
17View entire presentation