Cytek Investor Presentation Deck
Note: Fiscal Quarter
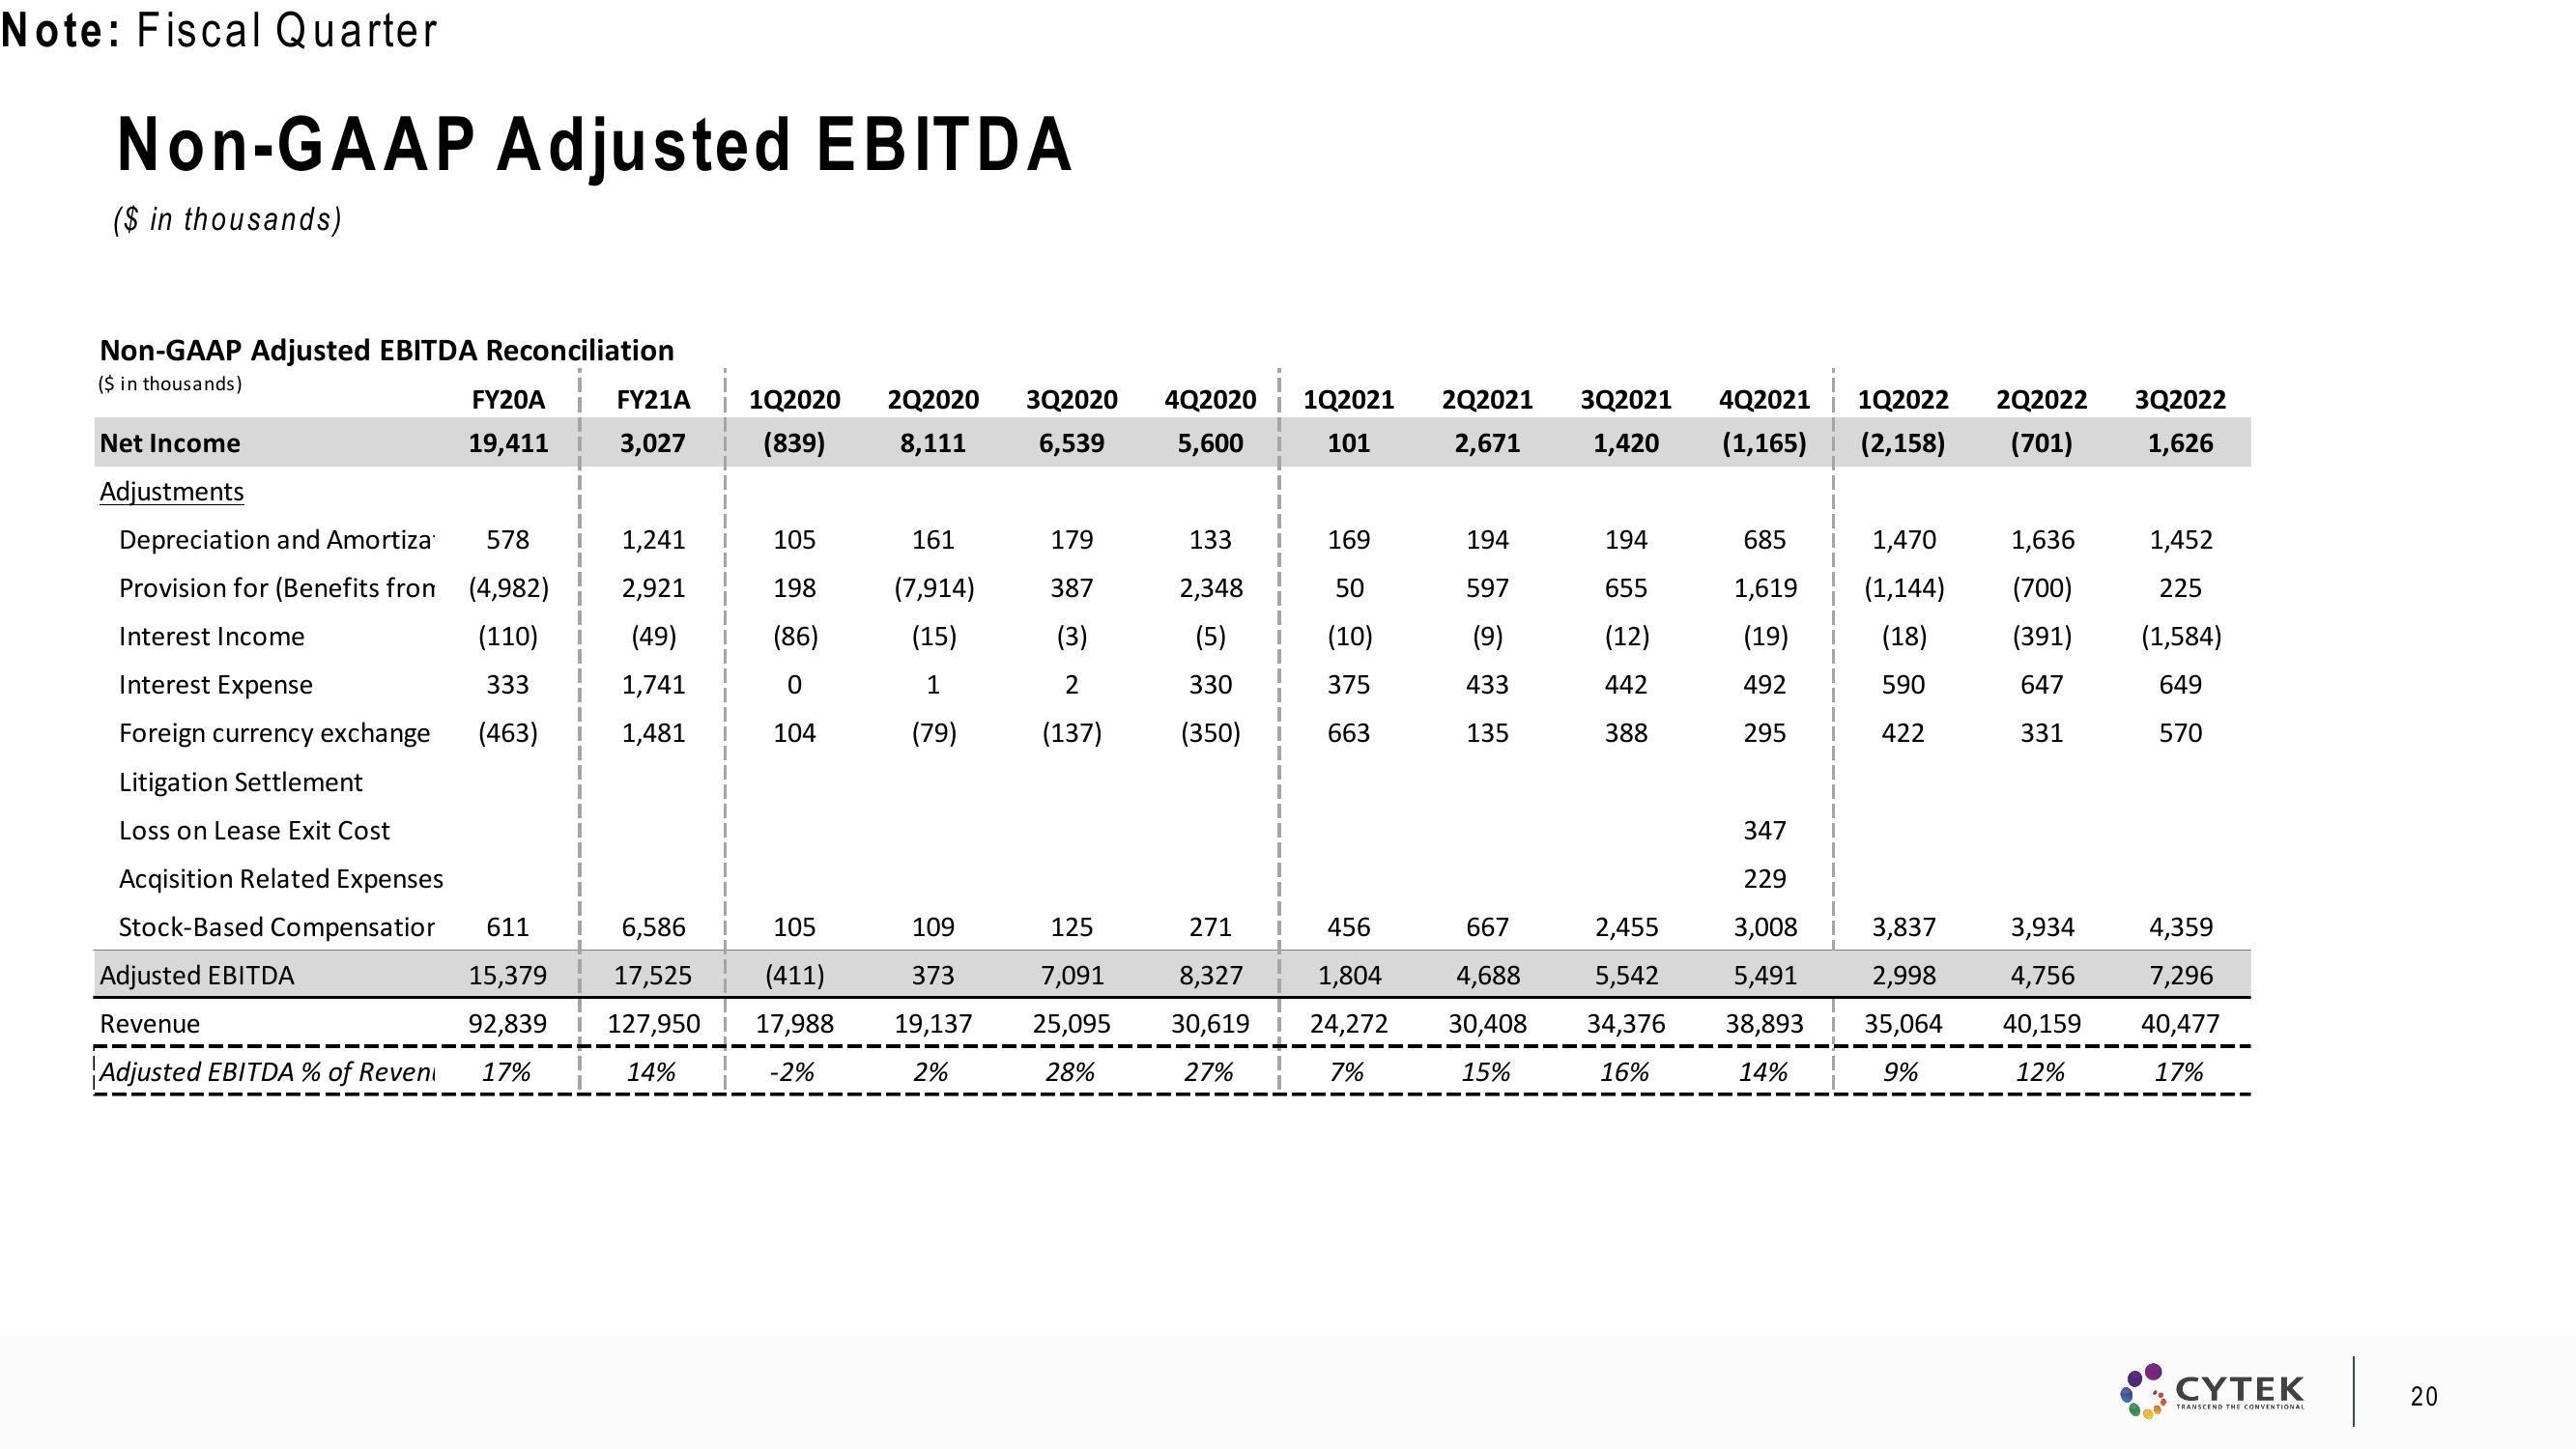
Non-GAAP Adjusted EBITDA
($ in thousands)
Non-GAAP Adjusted EBITDA Reconciliation
($ in thousands)
Net Income
Adjustments
Depreciation and Amortiza
Provision for (Benefits from
Interest Income
Interest Expense
Foreign currency exchange
Litigation Settlement
Loss on Lease Exit Cost
Acqisition Related Expenses
Stock-Based Compensatior
Adjusted EBITDA
Revenue
Adjusted EBITDA % of Reven
FY20A
19,411
578
(4,982)
(110)
333
(463)
611
15,379
92,839
17%
FY21A 1Q2020 2Q2020 3Q2020 4Q2020
3,027 (839) 8,111
5,600
6,539
1,241
2,921
(49)
1,741
1,481
105
198
(86)
0
104
161
(7,914)
(15)
1
(79)
6,586
105
109
17,525 (411)
373
127,950 17,988 19,137
14%
-2%
2%
179
387
(3)
2
(137)
125
7,091
25,095
28%
133
2,348
(5)
330
(350)
271
8,327
30,619
27%
1Q2021 2Q2021
101
2,671
169
50
(10)
375
663
456
1,804
24,272
7%
194
597
(9)
433
135
667
4,688
30,408
15%
3Q2021
1,420
194
655
(12)
442
388
4Q2021
(1,165)
685
1,619
(19)
492
295
1Q2022 2Q2022 3Q2022
(2,158) (701) 1,626
1,470
(1,144)
(18)
590
422
347
229
2,455
3,837
3,008
5,542 5,491
34,376 38,893 35,064
2,998
16%
14%
9%
1,636
(700)
(391)
647
331
3,934
4,756
40,159
12%
1,452
225
(1,584)
649
570
4,359
7,296
40,477
17%
CYTEK
TRANSCEND THE CONVENTIONAL
20View entire presentation