Oatly Results Presentation Deck
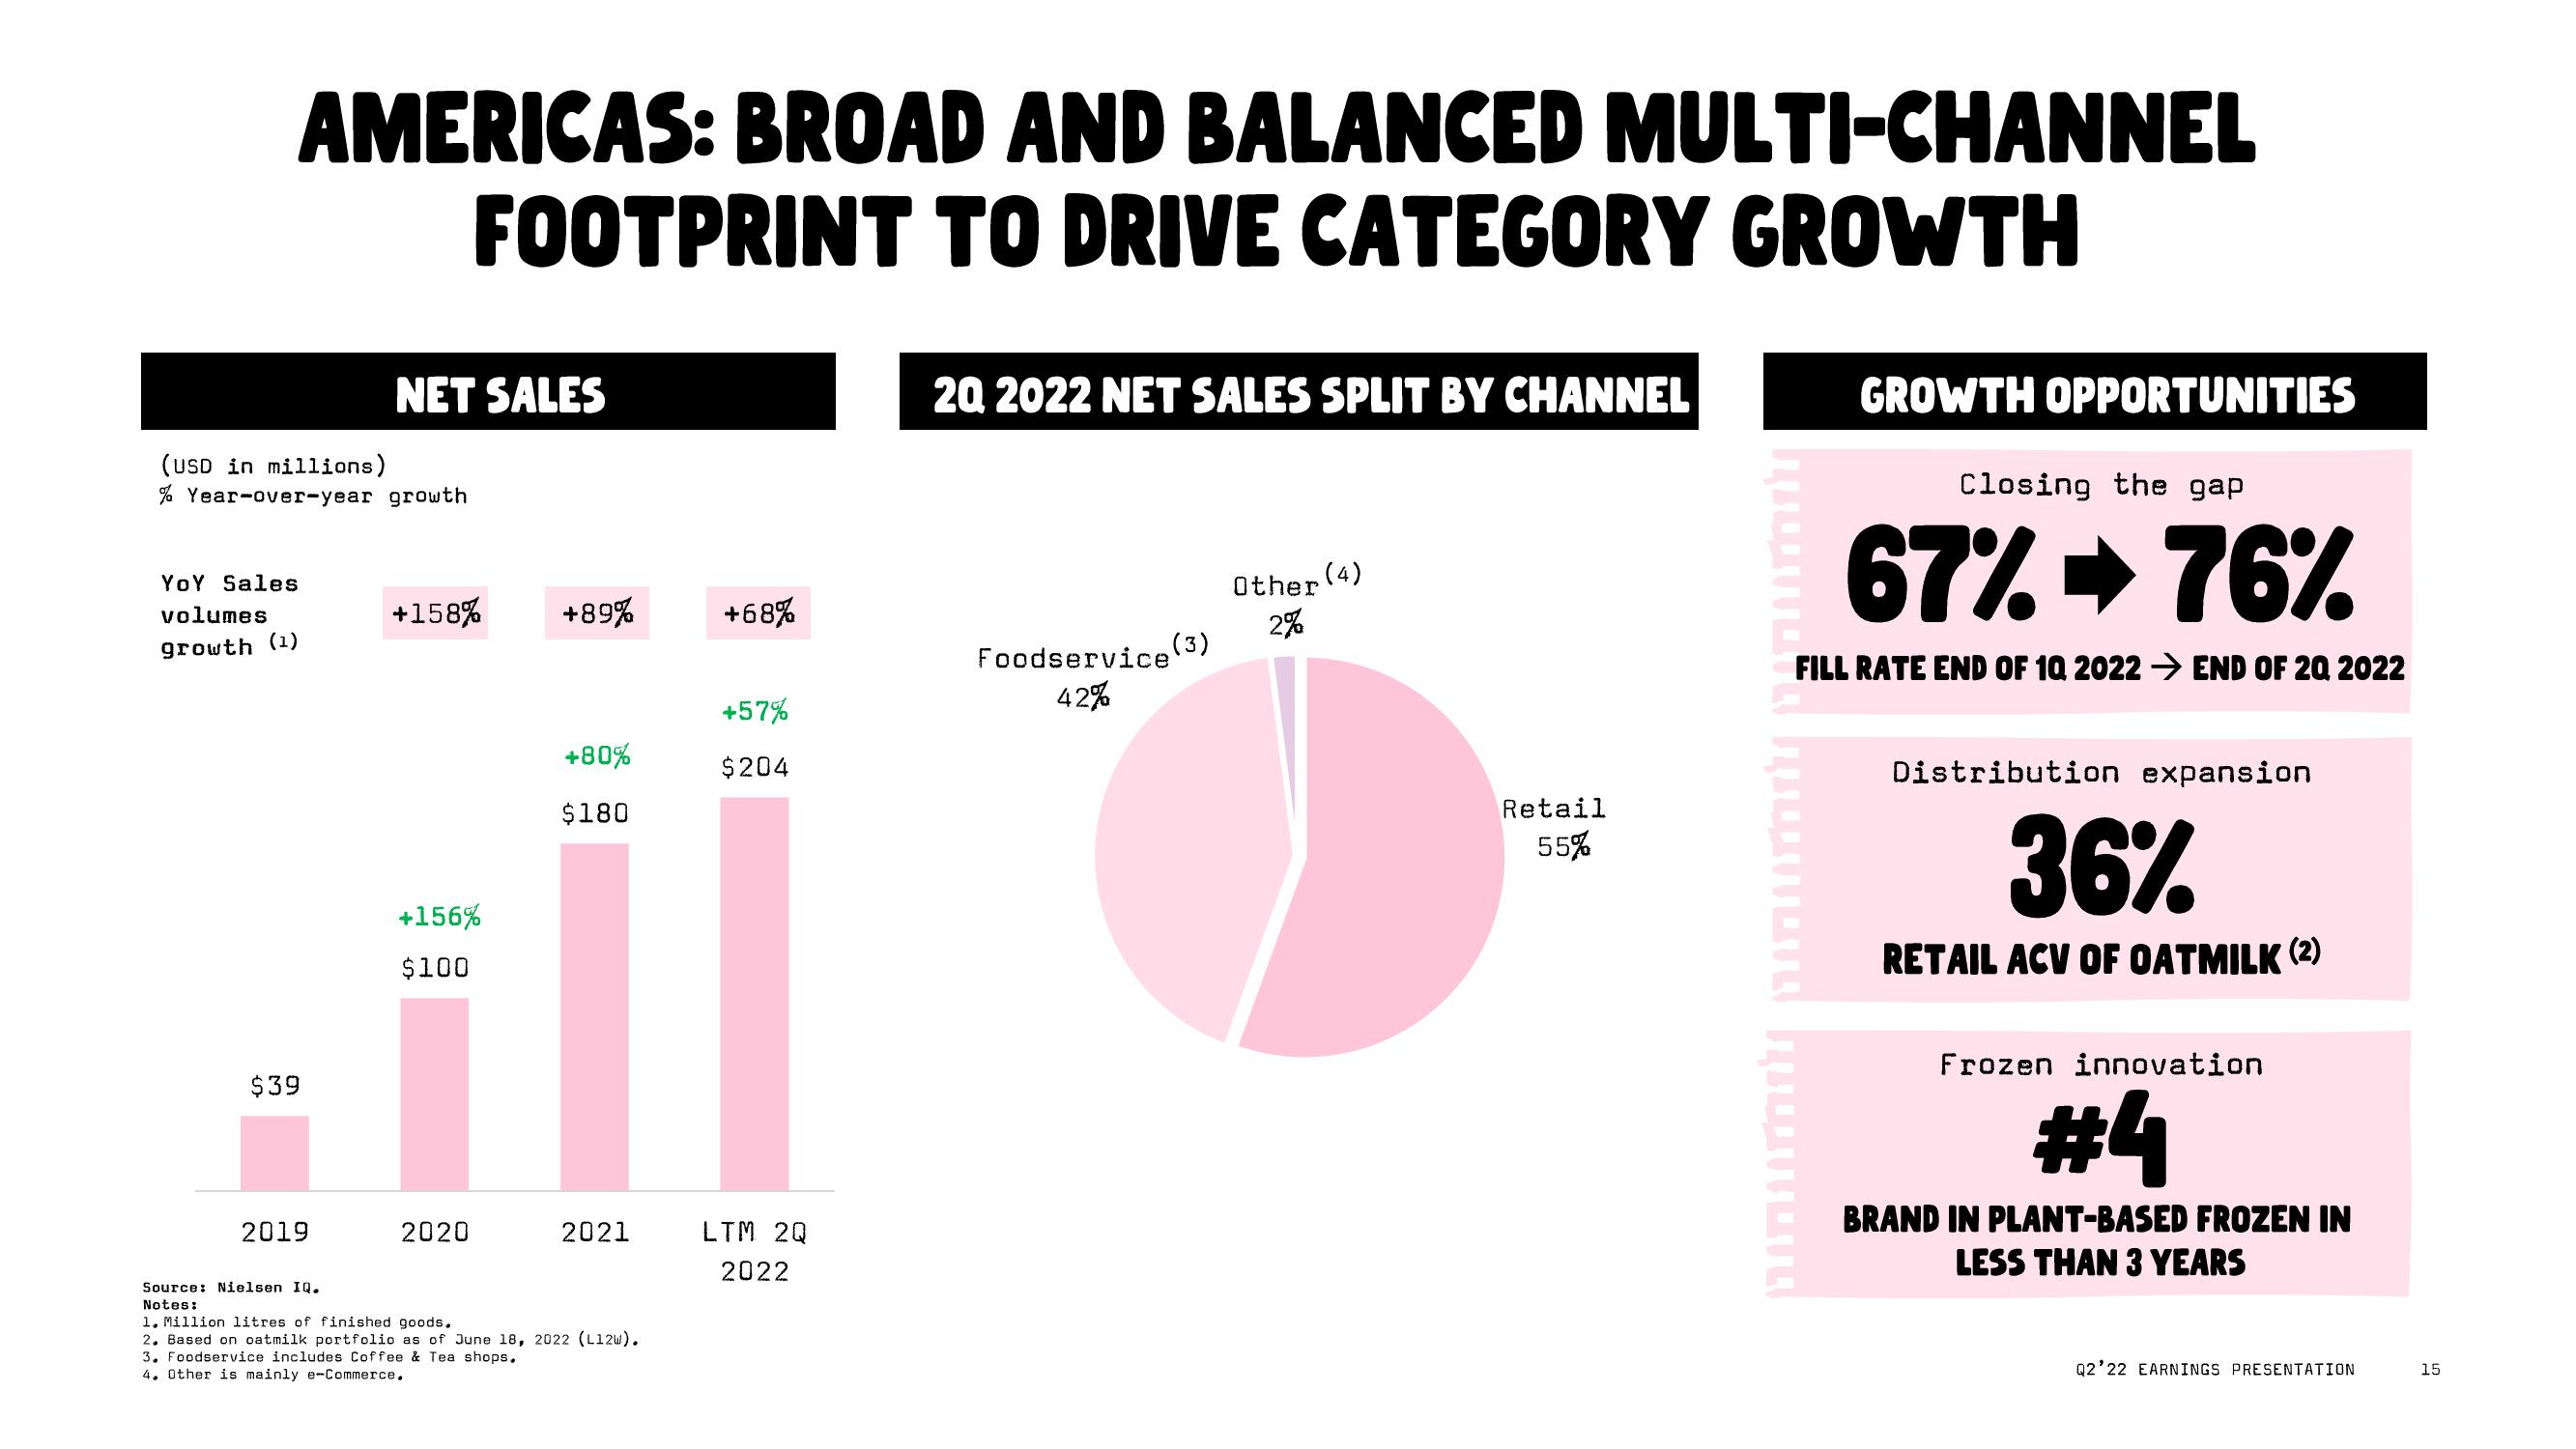
AMERICAS: BROAD AND BALANCED MULTI-CHANNEL
FOOTPRINT TO DRIVE CATEGORY GROWTH
(USD in millions)
% Year-over-year growth
YOY Sales
volumes
growth (1)
$39
2019
NET SALES
Source: Nielsen IQ.
Notes:
+158% +89%
+156%
$100
2020
+80%
$180
3. Foodservice includes Coffee & Tea shops.
4. Other is mainly e-Commerce.
2021
1. Million litres of finished goods.
2. Based on catmilk portfolio as of June 18, 2022 (L12w).
+68%
+57%
$204
LTM 2Q
2022
20 2022 NET SALES SPLIT BY CHANNEL
Foodservice (3)
42%
Other
2%
(4)
Retail
55%
MOTOR
GROWTH OPPORTUNITIES
Closing the gap
67%➡76%
FILL RATE END OF 1Q 2022 → END OF 2Q 2022
Distribution expansion
36%
RETAIL ACV OF OATMILK (2)
Frozen innovation
#4
BRAND IN PLANT-BASED FROZEN IN
LESS THAN 3 YEARS
Q2'22 EARNINGS PRESENTATION
15View entire presentation