Intertek Results Presentation Deck
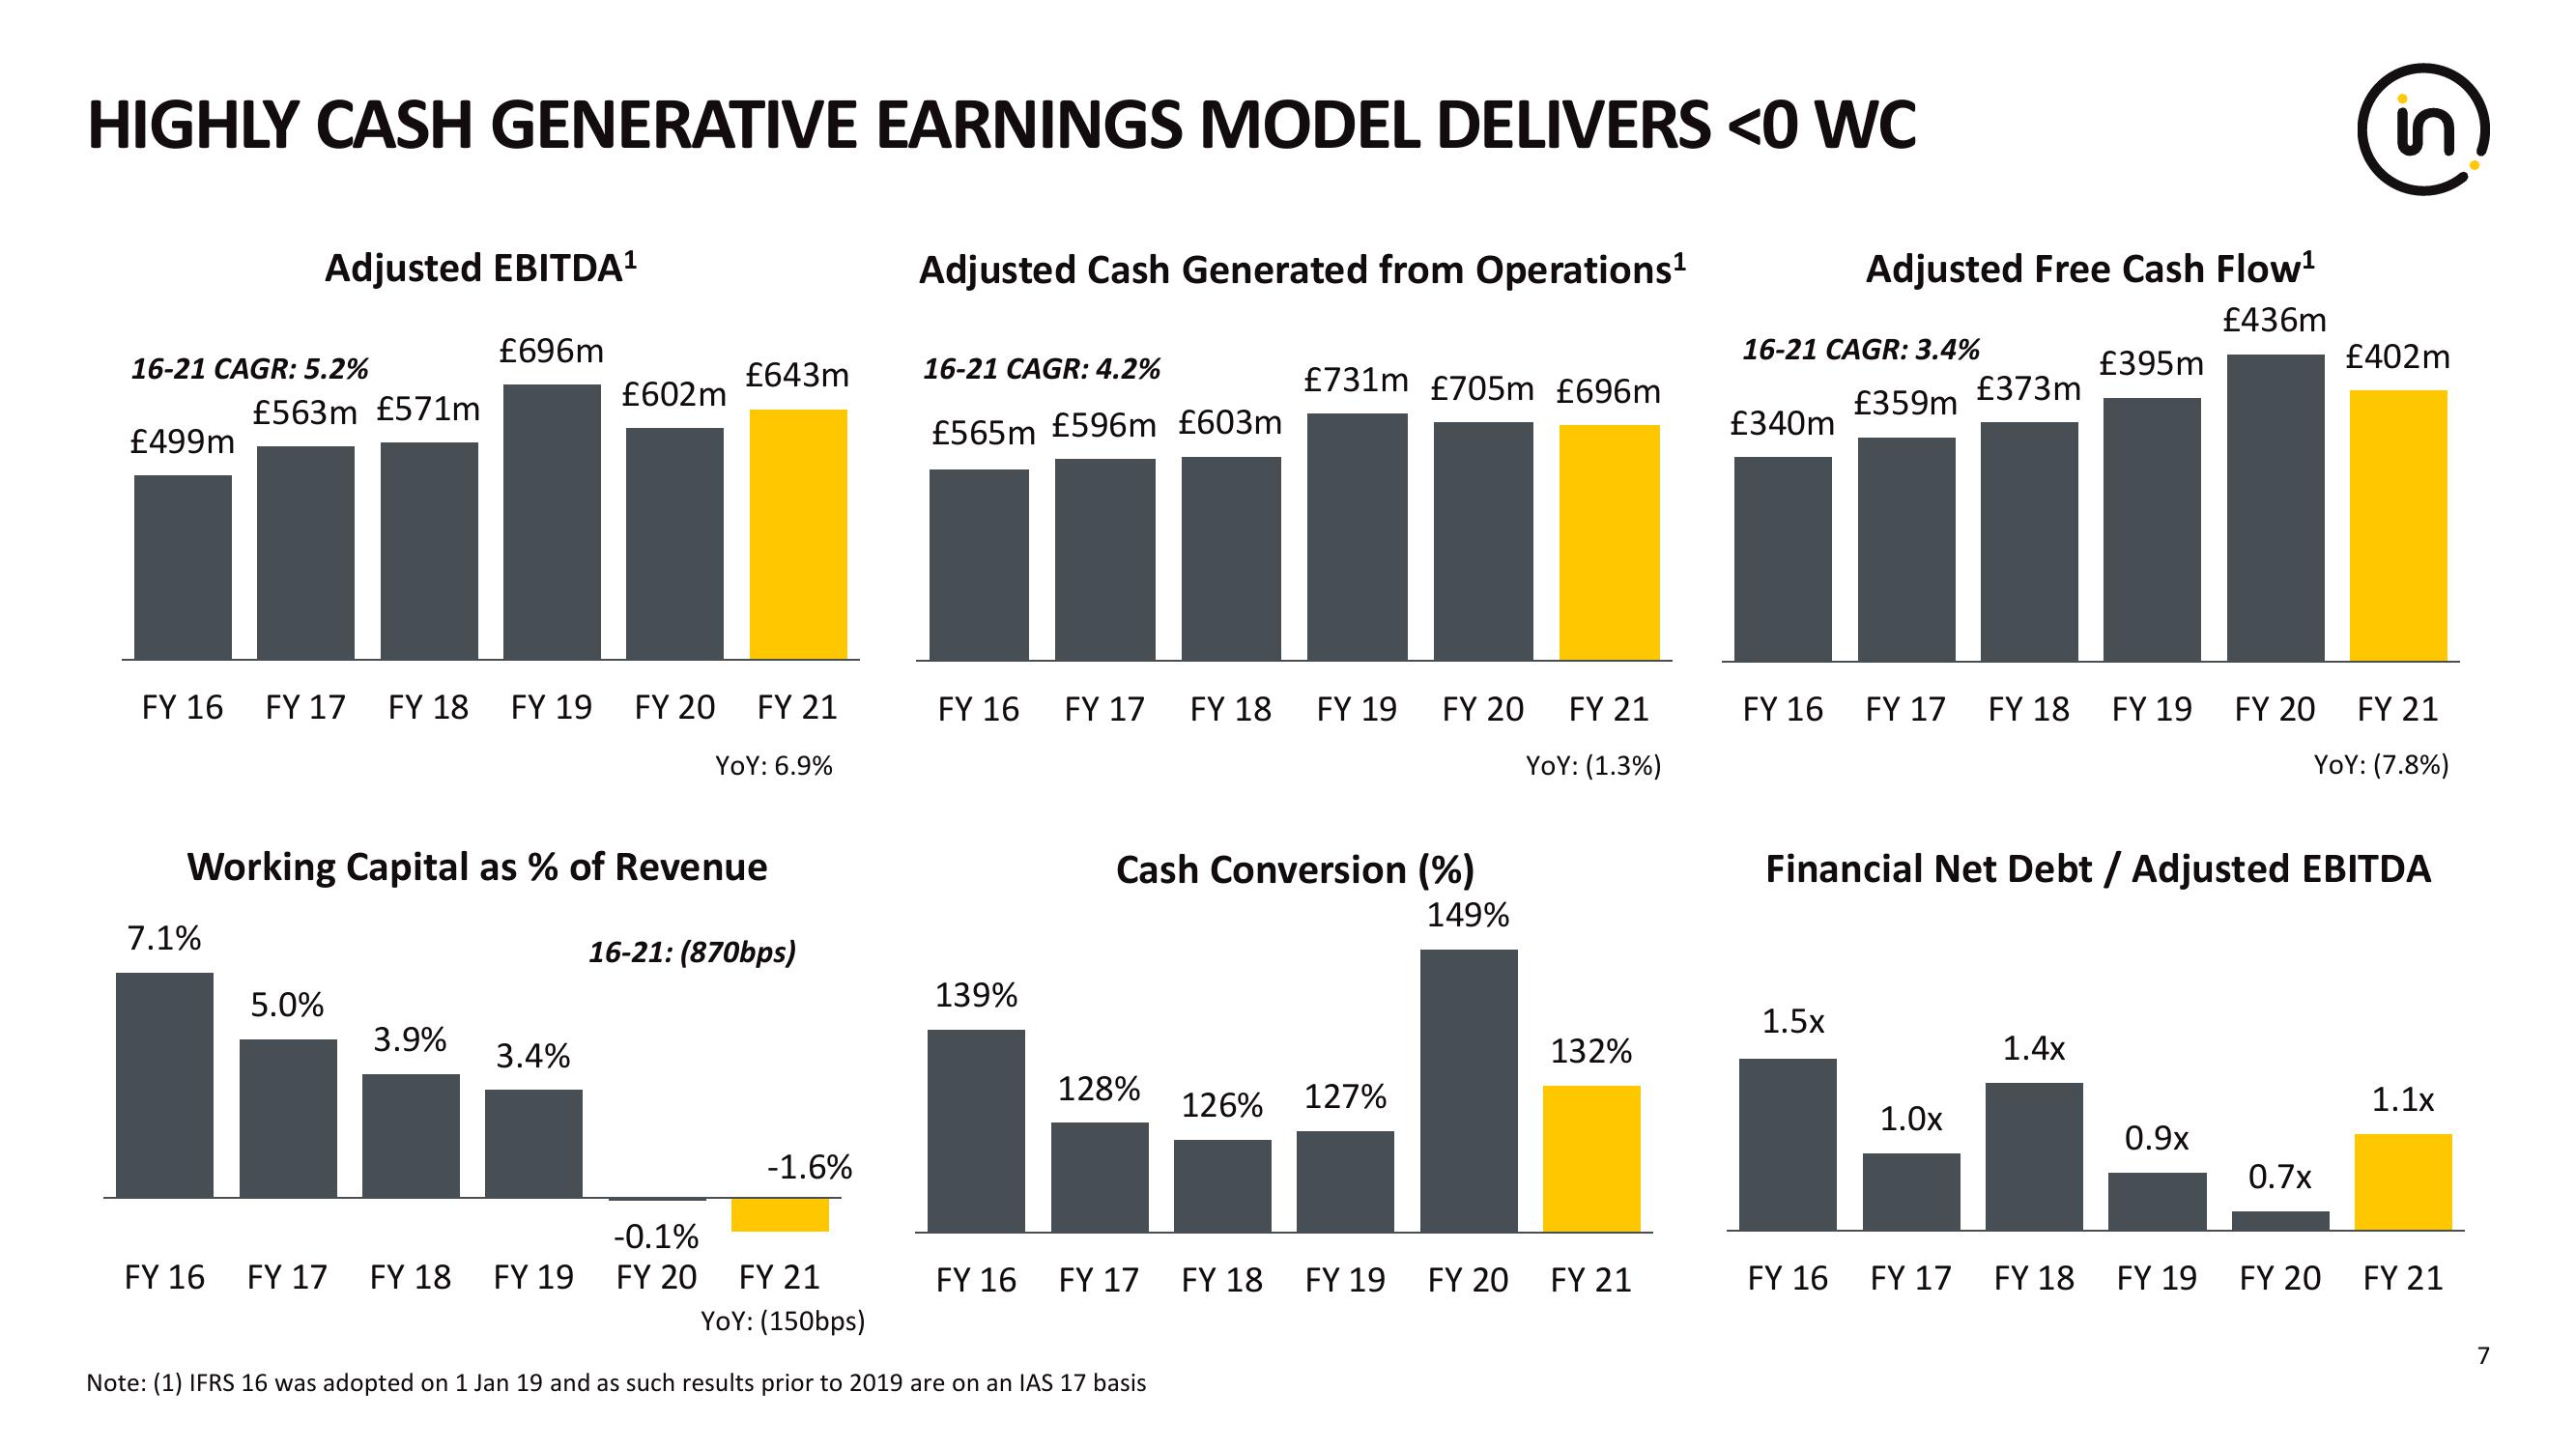
HIGHLY CASH GENERATIVE EARNINGS MODEL DELIVERS <0 WC
16-21 CAGR: 5.2%
£499m
Adjusted EBITDA¹
£563m £571m
7.1%
£696m
FY 16 FY 17 FY 18 FY 19 FY 20 FY 21
YOY: 6.9%
5.0%
Working Capital as % of Revenue
3.9%
£602m
3.4%
£643m
FY 16 FY 17 FY 18 FY 19
16-21: (870bps)
-0.1%
FY 20
-1.6%
Adjusted Cash Generated from Operations¹
16-21 CAGR: 4.2%
£565m £596m £603m
FY 16
139%
FY 17
128%
FY 21
YOY: (150bps)
Note: (1) IFRS 16 was adopted on 1 Jan 19 and as such results prior to 2019 are on an IAS 17 basis
Cash Conversion (%)
149%
£731m £705m £696m
FY 16 FY 17
FY 18 FY 19 FY 20 FY 21
YOY: (1.3%)
126% 127%
132%
FY 18 FY 19 FY 20 FY 21
16-21 CAGR: 3.4%
£359m
£340m
Adjusted Free Cash Flow¹
£436m
1.5x
FY 16
£373m
1.0x
FY 16 FY 17 FY 18 FY 19 FY 20 FY 21
YOY: (7.8%)
FY 17
Financial Net Debt / Adjusted EBITDA
£395m
1.4x
FY 18
0.9x
FY 19
in
0.7x
S
FY 20
£402m
1.1x
FY 21
7View entire presentation