Enact IPO Presentation Deck
Enact | Investor Presentation
Strong capitalization driven by prudently-managed
balance sheet
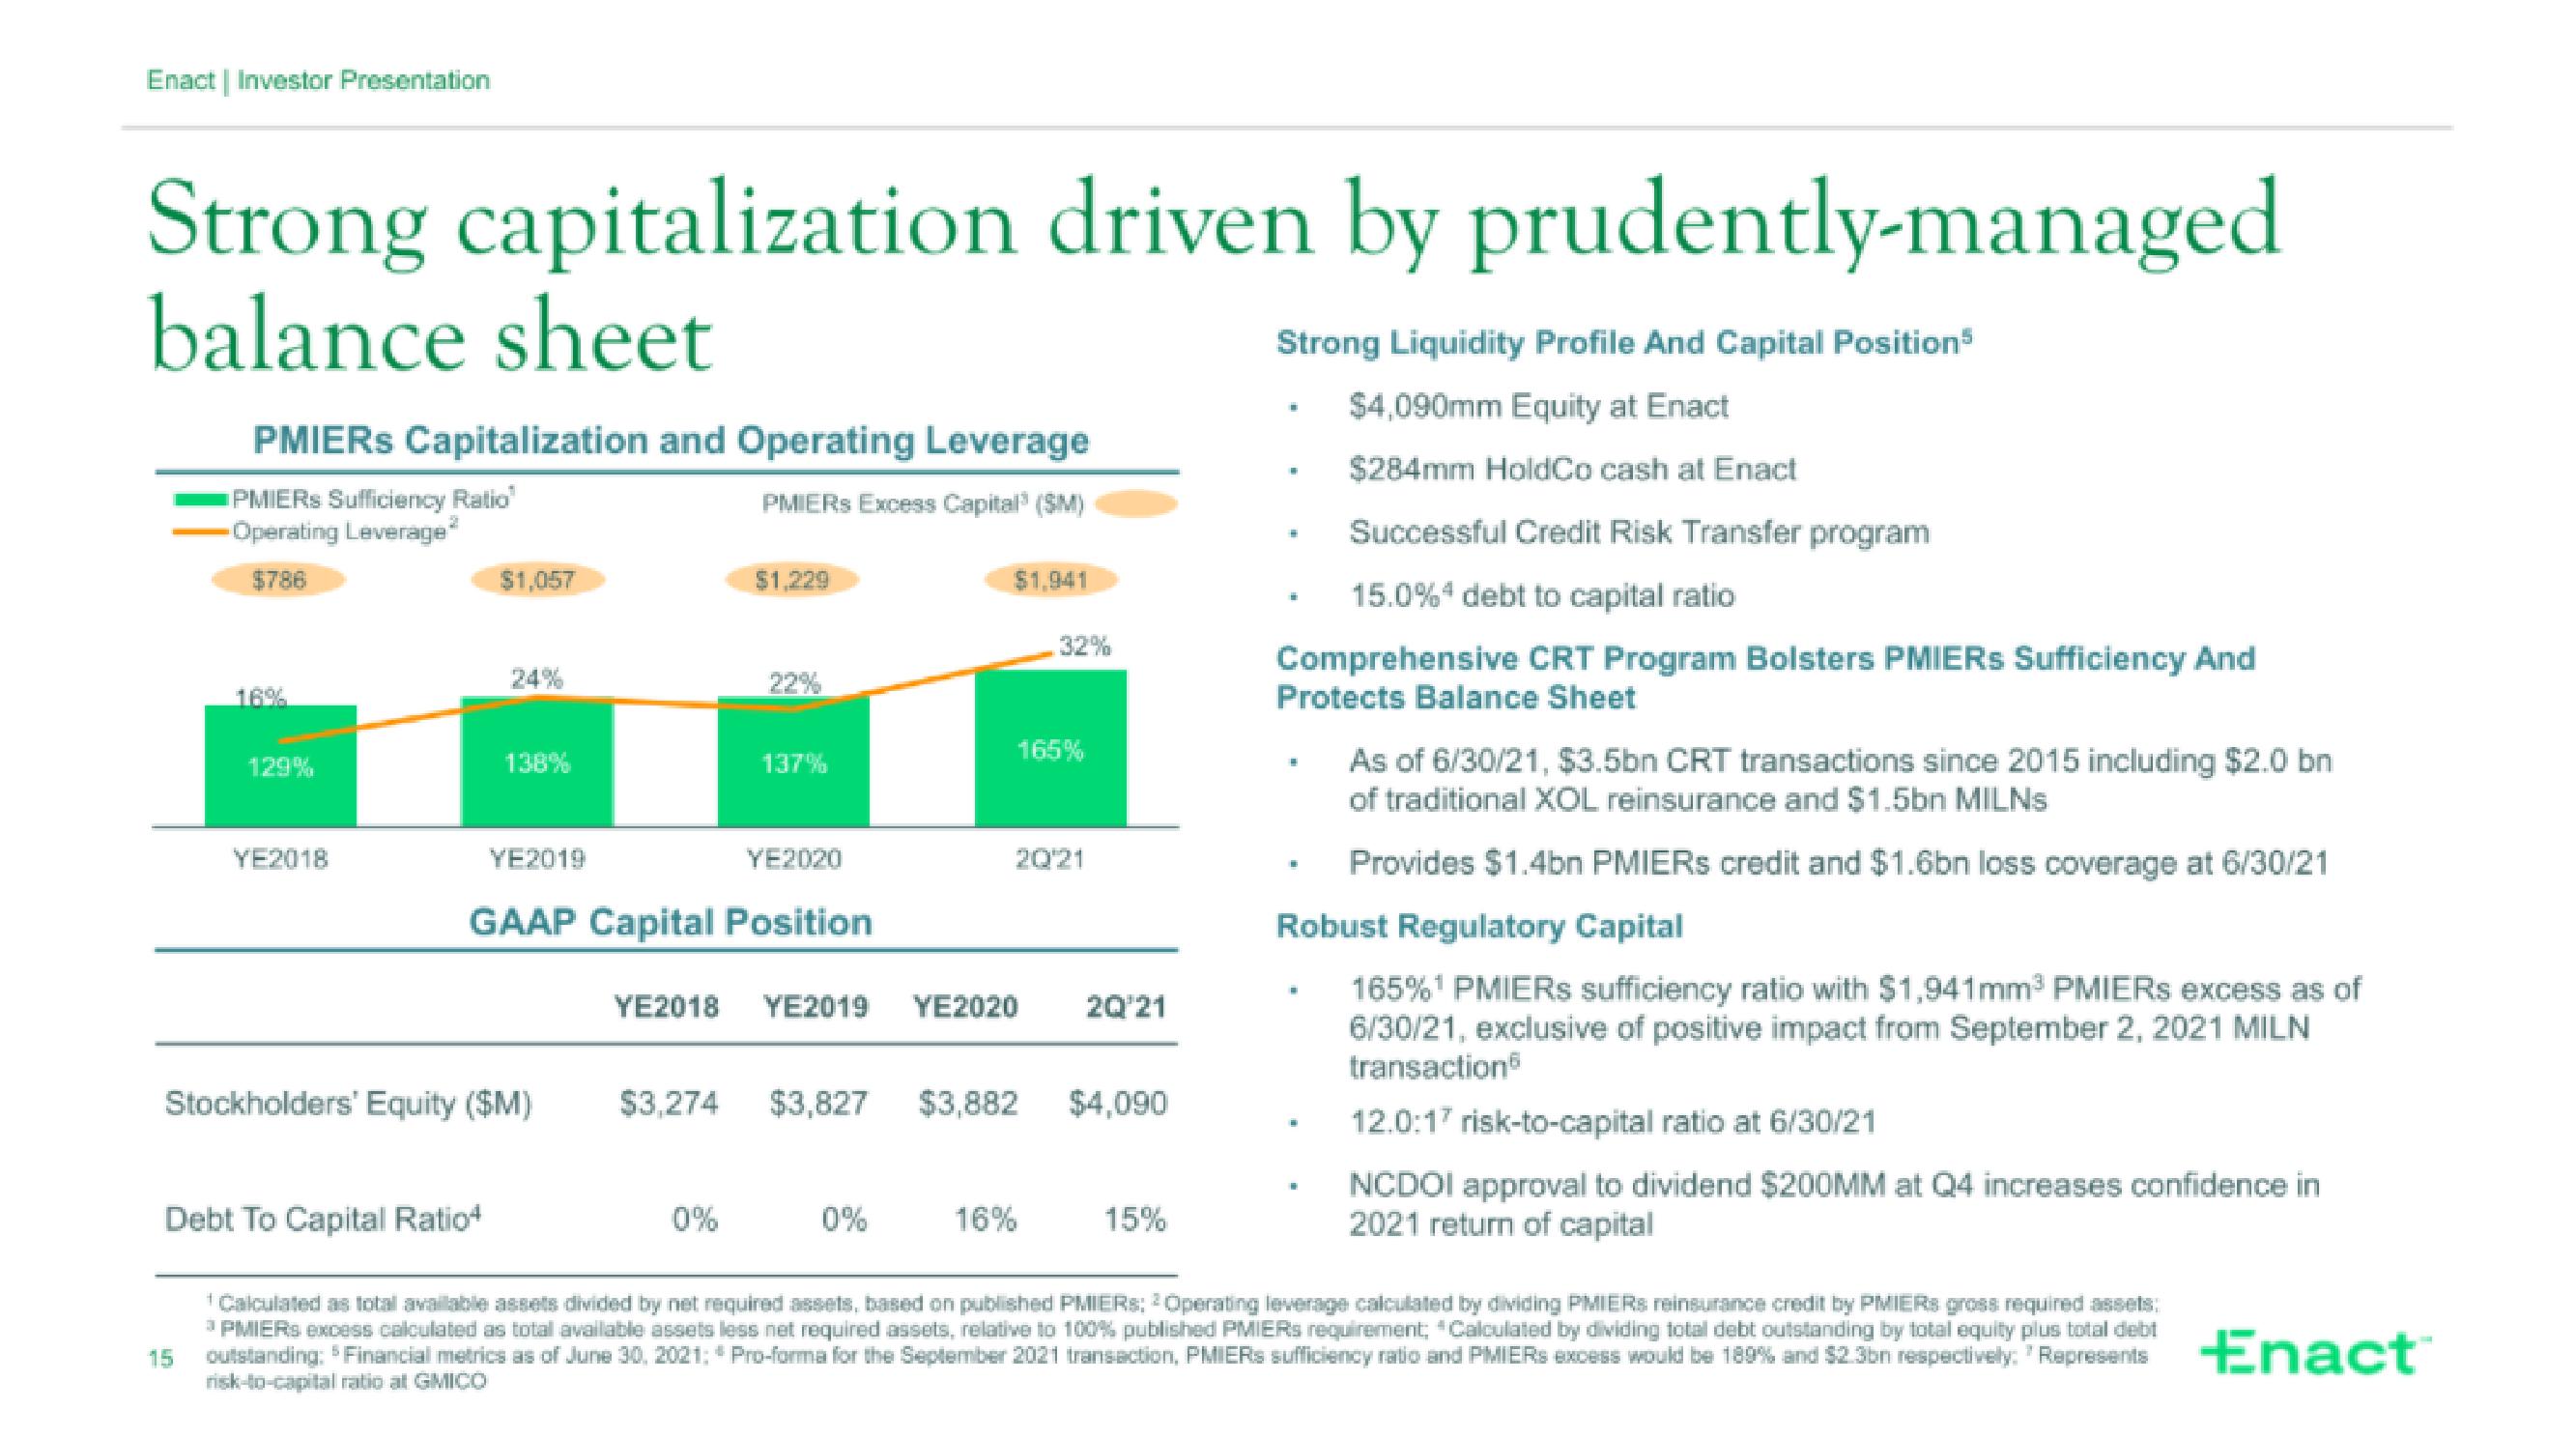
PMIERS Capitalization and Operating Leverage
PMIERS Excess Capital³ (SM)
PMIERS Sufficiency Ratio
2
Operating Leverage
$786
15
16%
129%
YE2018
Debt To Capital Ratio
$1,057
24%
138%
YE2019
Stockholders' Equity ($M)
$1,229
137%
GAAP Capital Position
YE2020
0%
$1,941
YE2018 YE2019 YE2020
0%
$3,274 $3,827 $3,882
165%
20′21
32%
16%
2Q'21
$4,090
15%
Strong Liquidity Profile And Capital Position³
$4,090mm Equity at Enact
$284mm HoldCo cash at Enact
Successful Credit Risk Transfer program
15.0% 4 debt to capital ratio
Comprehensive CRT Program Bolsters PMIERS Sufficiency And
Protects Balance Sheet
#
■
As of 6/30/21, $3.5bn CRT transactions since 2015 including $2.0 bn
of traditional XOL reinsurance and $1.5bn MILNs
Provides $1.4bn PMIERS credit and $1.6bn loss coverage at 6/30/21
Robust Regulatory Capital
165%¹ PMIERS sufficiency ratio with $1,941mm³ PMIERS excess as of
6/30/21, exclusive of positive impact from September 2, 2021 MILN
transaction
.
.
#
12.0:17 risk-to-capital ratio at 6/30/21
NCDOI approval to dividend $200MM at Q4 increases confidence in
2021 return of capital
¹ Calculated as total available assets divided by net required assets, based on published PMIERS: 2 Operating leverage calculated by dividing PMIERS reinsurance credit by PMIERS gross required assets;
³PMIERS excess calculated as total available assets less net required assets, relative to 100% published PMIERS requirement, *Calculated by dividing total debt outstanding by total equity plus total debi
outstanding: Financial metrics as of June 30, 2021; Pro-forma for the September 2021 transaction, PMIERS sufficiency ratio and PMIERS excess would be 189% and $2.3bn Represents Enact™
risk-to-capital ratio at GMICOView entire presentation