Flutter Investor Day Presentation Deck
UK & Ireland
Pro forma £m
Average monthly players ('000s)
Sportsbook stakes
Sportsbook net revenue margin
Sports revenue
Gaming revenue
Total revenue
Cost of sales
Cost of sales as a % of net revenue
Gross profit
Sales & marketing costs
Contribution
Other operating costs
Adjusted EBITDA
Adjusted EBITDA margin
Depreciation and amortisation
Adjusted operating profit
Flutter
ONLINE
36.4%
(42)
356
RETAIL
H1 2021|H1 2020
YOY
3,303 2,299
+44%
5,885 3,231
10.6%
12.6%
+82%
-200bps
+52%
712
470
382
327
+17%
1,094
796
+37%
(332) (224) +48%
30.4%
28.2%
+220bps
762
572
+33%
(204)
(166)
+23%
558
406
+37%
(160)
(146)
+9% (68) (69)
398
260
+53%
+370bps
(39) (10)
(93.6%)
(21)
(12.4%)
+15%
(21)
+59%
(59) (31)
32.7%
(36)
224
H1 2021|H1 2020
383
207
12.5%
26
14.6%
56
16
23
79
41
(10) (17)
21.6%
23.4%
32
62
(3)
29
(3)
59
YOY
-46%
-210bps
-54%
-33%
-47%
-43%
+180bps
-49%
-51%
-2%
+296%
-8,120bps
-3%
+91%
Online
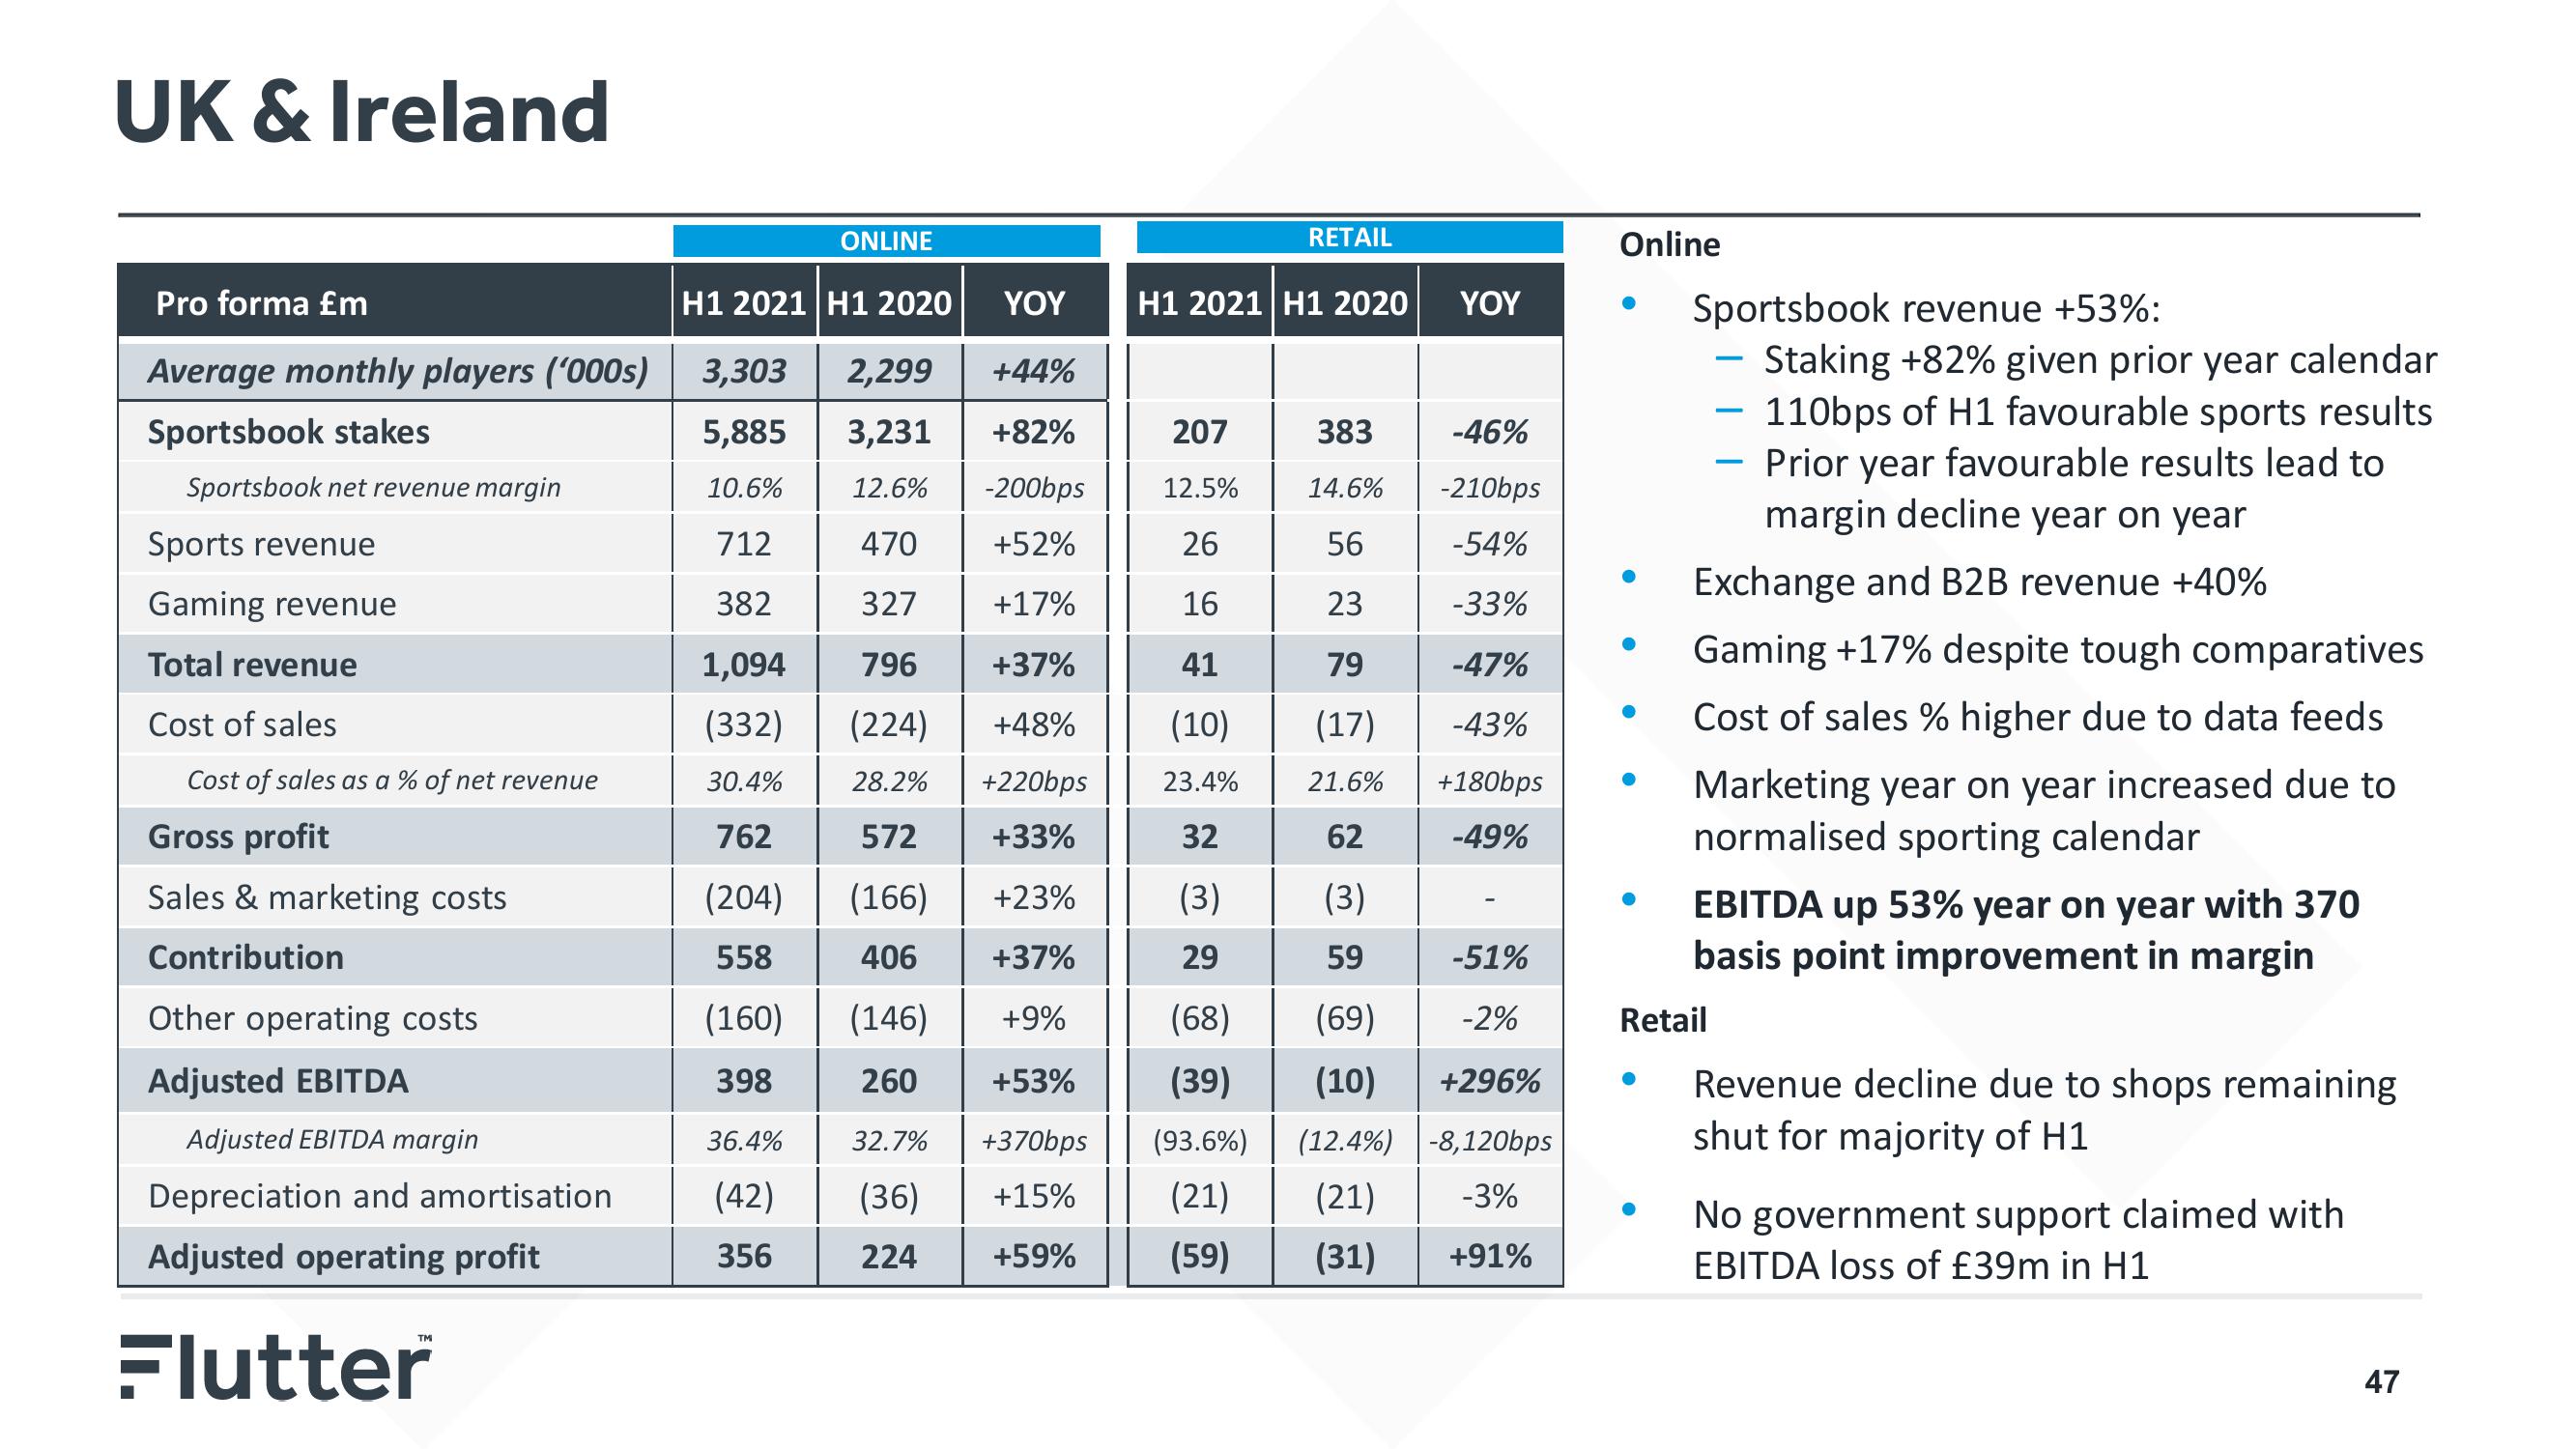
Sportsbook revenue +53%:
-
Staking +82% given prior year calendar
110bps of H1 favourable sports results
Prior year favourable results lead to
margin decline year on year
Exchange and B2B revenue +40%
Gaming +17% despite tough comparatives
Cost of sales % higher due to data feeds
Marketing year on year increased due to
normalised sporting calendar
Retail
EBITDA up 53% year on year with 370
basis point improvement in margin
Revenue decline due to shops remaining
shut for majority of H1
No government support claimed with
EBITDA loss of £39m in H1
47View entire presentation