Hilltop Holdings Results Presentation Deck
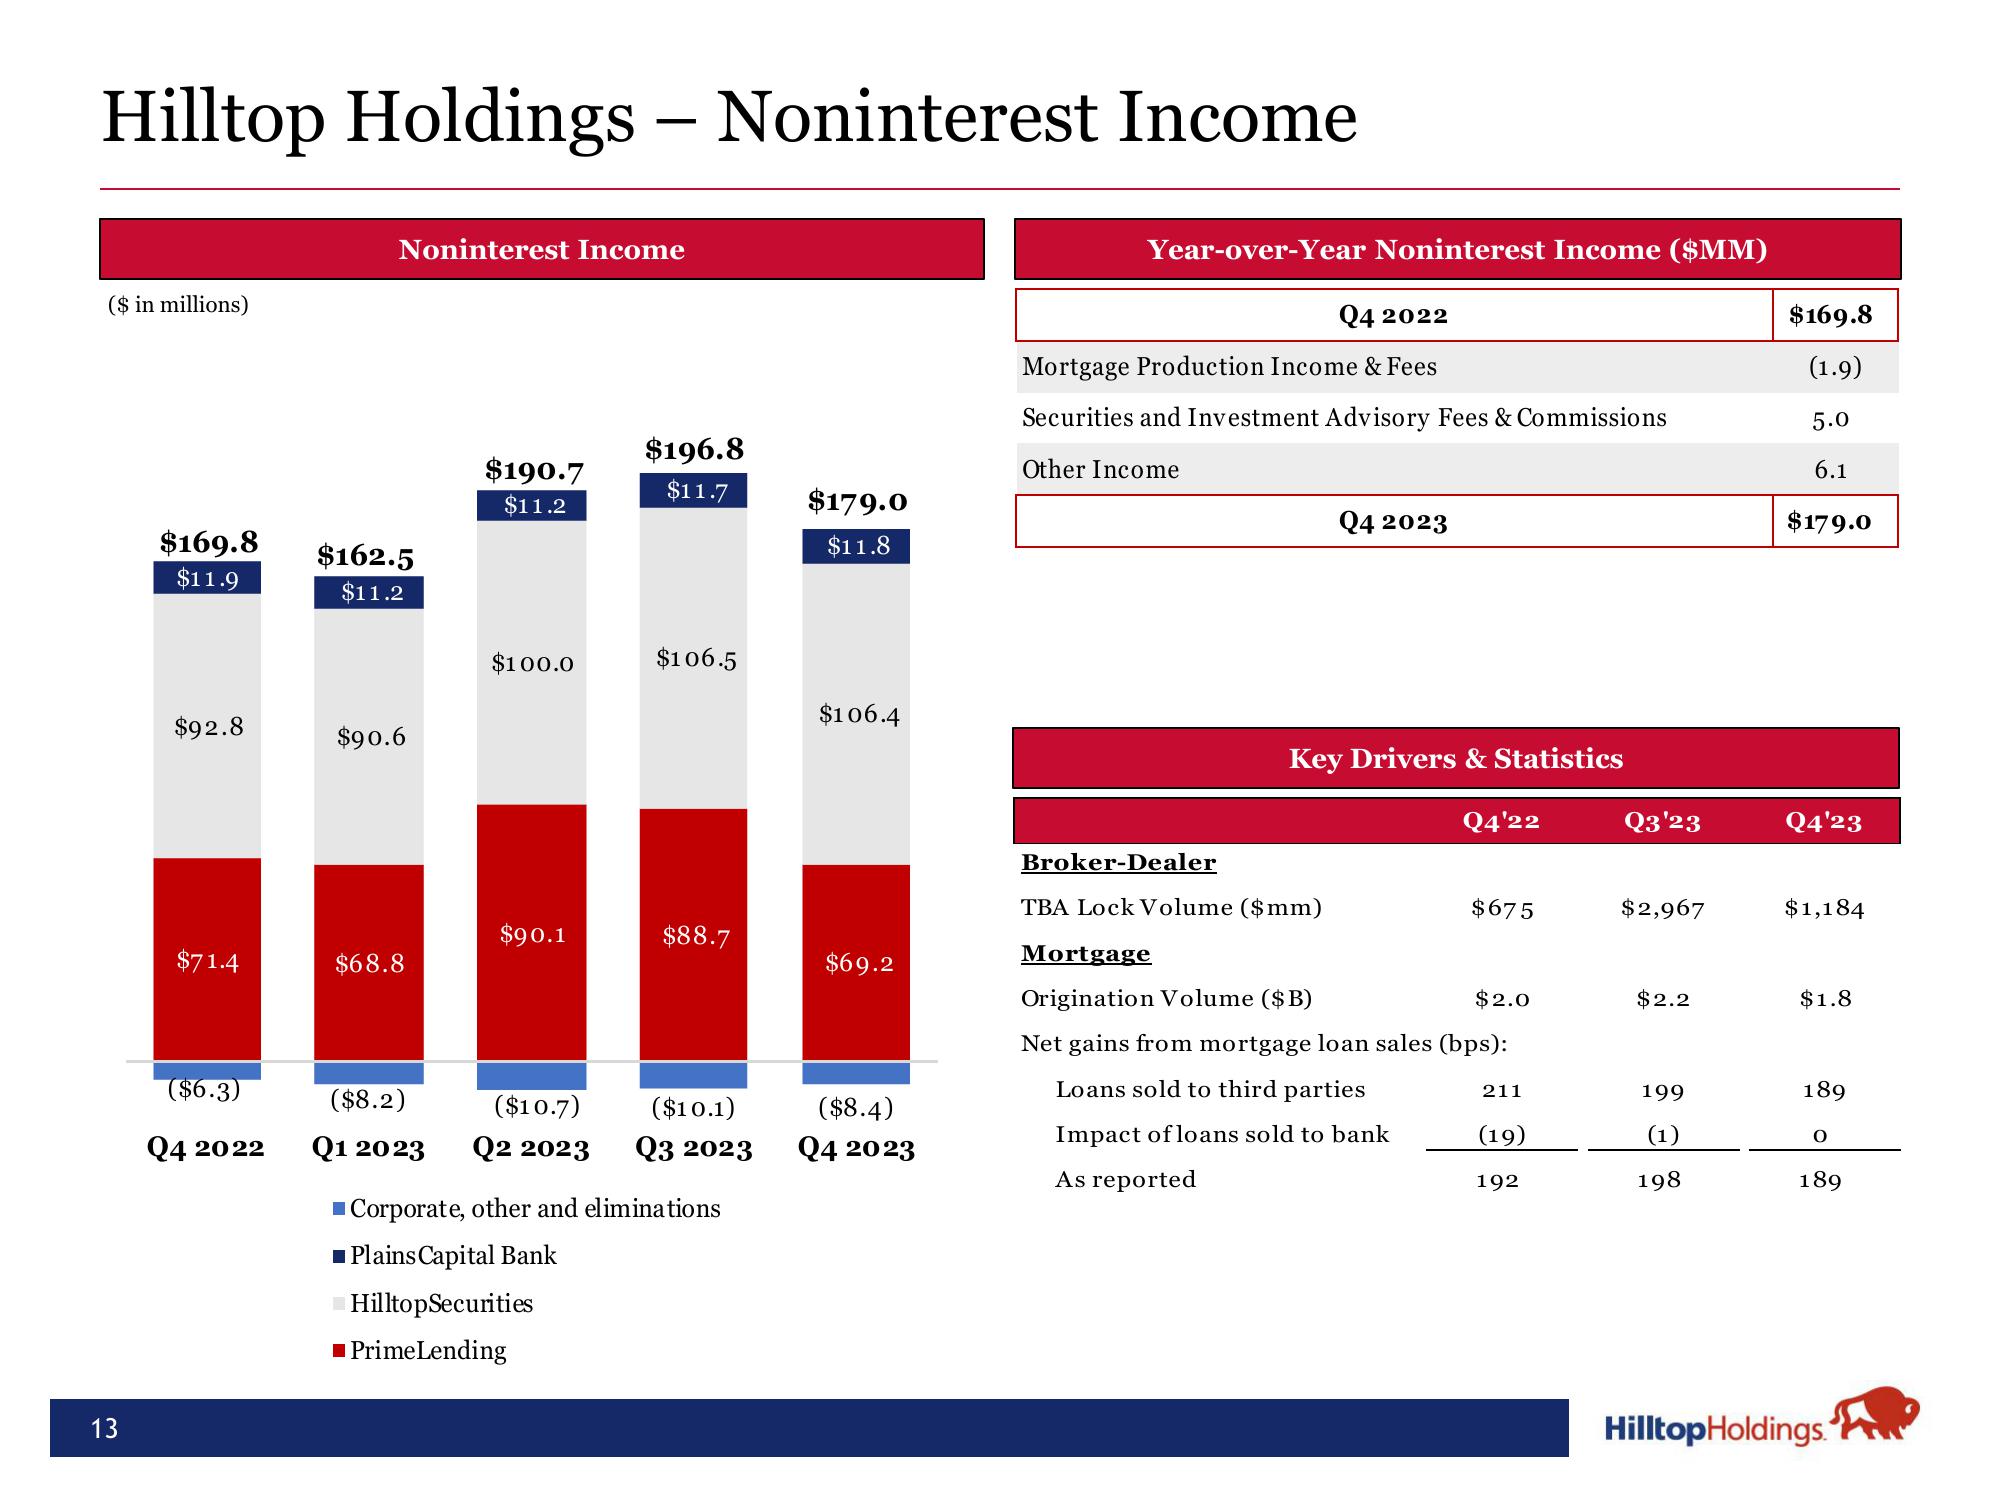
Hilltop Holdings - Noninterest Income
($ in millions)
13
$169.8
$11.9
$92.8
$71.4
($6.3)
Q4 2022
Noninterest Income
$162.5
$11.2
$90.6
$68.8
$190.7
$11.2
$100.0
$90.1
($8.2)
Q1 2023 Q2 2023
$196.8
$11.7
$106.5
■ Prime Lending
$88.7
($10.7) ($10.1)
Q3 2023
Corporate, other and eliminations
■Plains Capital Bank
Hilltop Securities
$179.0
$11.8
$106.4
$69.2
($8.4)
Q4 2023
Year-over-Year Noninterest Income ($MM)
Q4 2022
Mortgage Production Income & Fees
Securities and Investment Advisory Fees & Commissions
Other Income
Q4 2023
Key Drivers & Statistics
Broker-Dealer
TBA Lock Volume ($mm)
Q4'22
$675
Mortgage
Origination Volume ($B)
$2.0
Net gains from mortgage loan sales (bps):
Loans sold to third parties
Impact of loans sold to bank
As reported
211
(19)
192
Q3'23
$2,967
$2.2
199
(1)
198
$169.8
(1.9)
5.0
6.1
$179.0
Q4'23
$1,184
$1.8
189
O
189
Hilltop Holdings.View entire presentation