Allwyn Results Presentation Deck
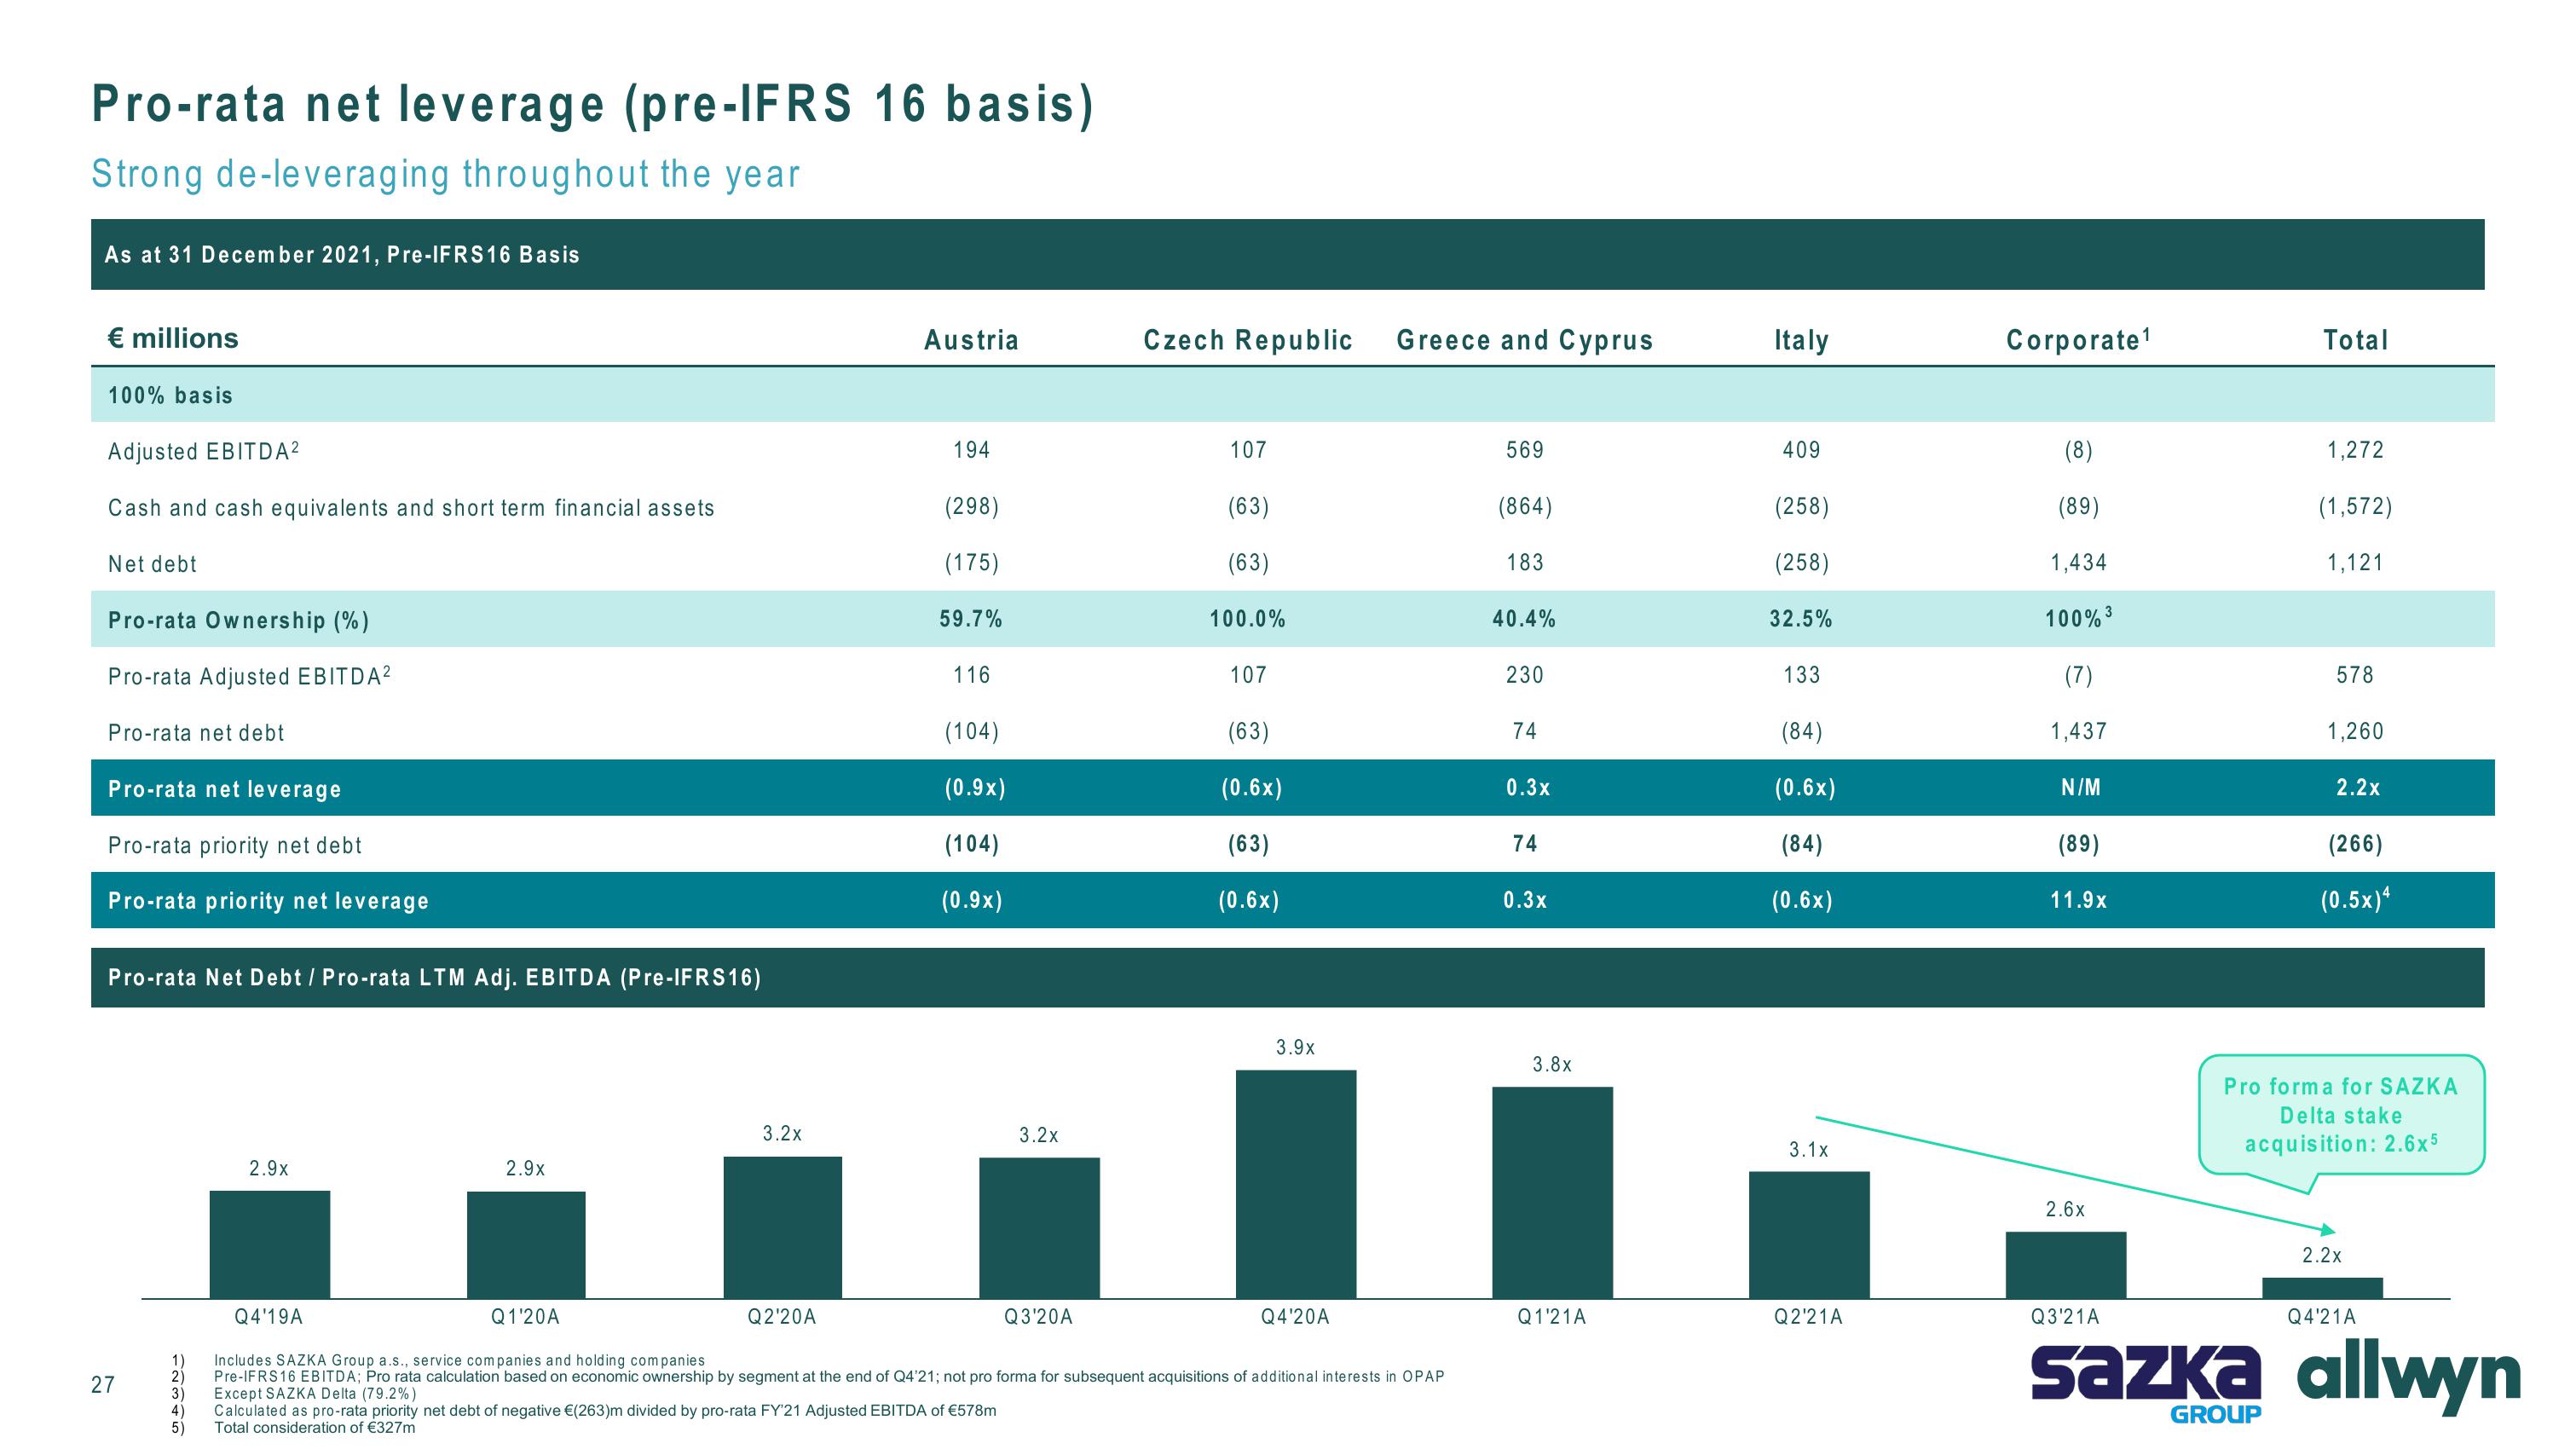
Pro-rata net leverage (pre-IFRS 16 basis)
Strong de-leveraging throughout the year
As at 31 December 2021, Pre-IFRS16 Basis
€ millions
100% basis
Adjusted EBITDA²
Cash and cash equivalents and short term financial assets
Net debt
Pro-rata Ownership (%)
Pro-rata Adjusted EBITDA²
Pro-rata net debt
Pro-rata net leverage
Pro-rata priority net debt
Pro-rata priority net leverage
Pro-rata Net Debt / Pro-rata LTM Adj. EBITDA (Pre-IFRS16)
27
1)
2)
3)
4)
5)
2.9x
Q4'19A
2.9x
Austria
Q1'20A
194
(298)
(175)
59.7%
116
(104)
(0.9x)
(104)
(0.9x)
3.2x
Czech Republic
3.2x
…….
Q2'20A
Q3'20A
107
(63)
(63)
100.0%
107
(63)
(0.6x)
(63)
(0.6x)
3.9x
Greece and Cyprus
Q4'20A
Includes SAZKA Group a.s., service companies and holding companies
Pre-IFRS16 EBITDA; Pro rata calculation based on economic ownership by segment at the end of Q4'21; not pro forma for subsequent acquisitions of additional interests in OPAP
Except SAZKA Delta (79.2%)
Calculated as pro-rata priority net debt of negative €(263)m divided by pro-rata FY'21 Adjusted EBITDA of €578m
Total consideration of €327m
569
(864)
183
40.4%
230
74
0.3x
74
0.3x
3.8x
Q1'21A
Italy
409
(258)
(258)
32.5%
133
(84)
(0.6x)
(84)
(0.6x)
3.1x
Q2'21A
Corporate¹
(8)
(89)
1,434
100% ³
(7)
1,437
N/M
(89)
11.9x
2.6x
Q3'21A
Total
1,272
GROUP
(1,572)
1,121
578
1,260
2.2x
(266)
(0.5x)4
Pro forma for SAZKA
Delta stake
acquisition: 2.6x5
2.2x
Q4'21A
sazka allwynView entire presentation