Comcast Results Presentation Deck
Cable Communications 2nd Quarter 2022 Overview
Customer Relationships (M) Revenue
Per CR*
Adjusted EBITDA
5
33.8
2Q21
*
$7.1
$70.07
+3.0%
+1.7%
34.4
2Q22
+5.3%
$7.4
$72.18
$16.0
2Q21
($B) Net Cash Flow
$5.0
+3.7%
2Q21
$16.6
2Q22
+4.4%
$5.3
($B)
2Q21
2Q22
Represents average monthly results per customer relationship.
All percentages represent year/year growth rates, except Adjusted EBITDA margin and Capital Expenditures as a % of Revenue.
See Notes on Slide 11
2Q22
($B)
Commentary
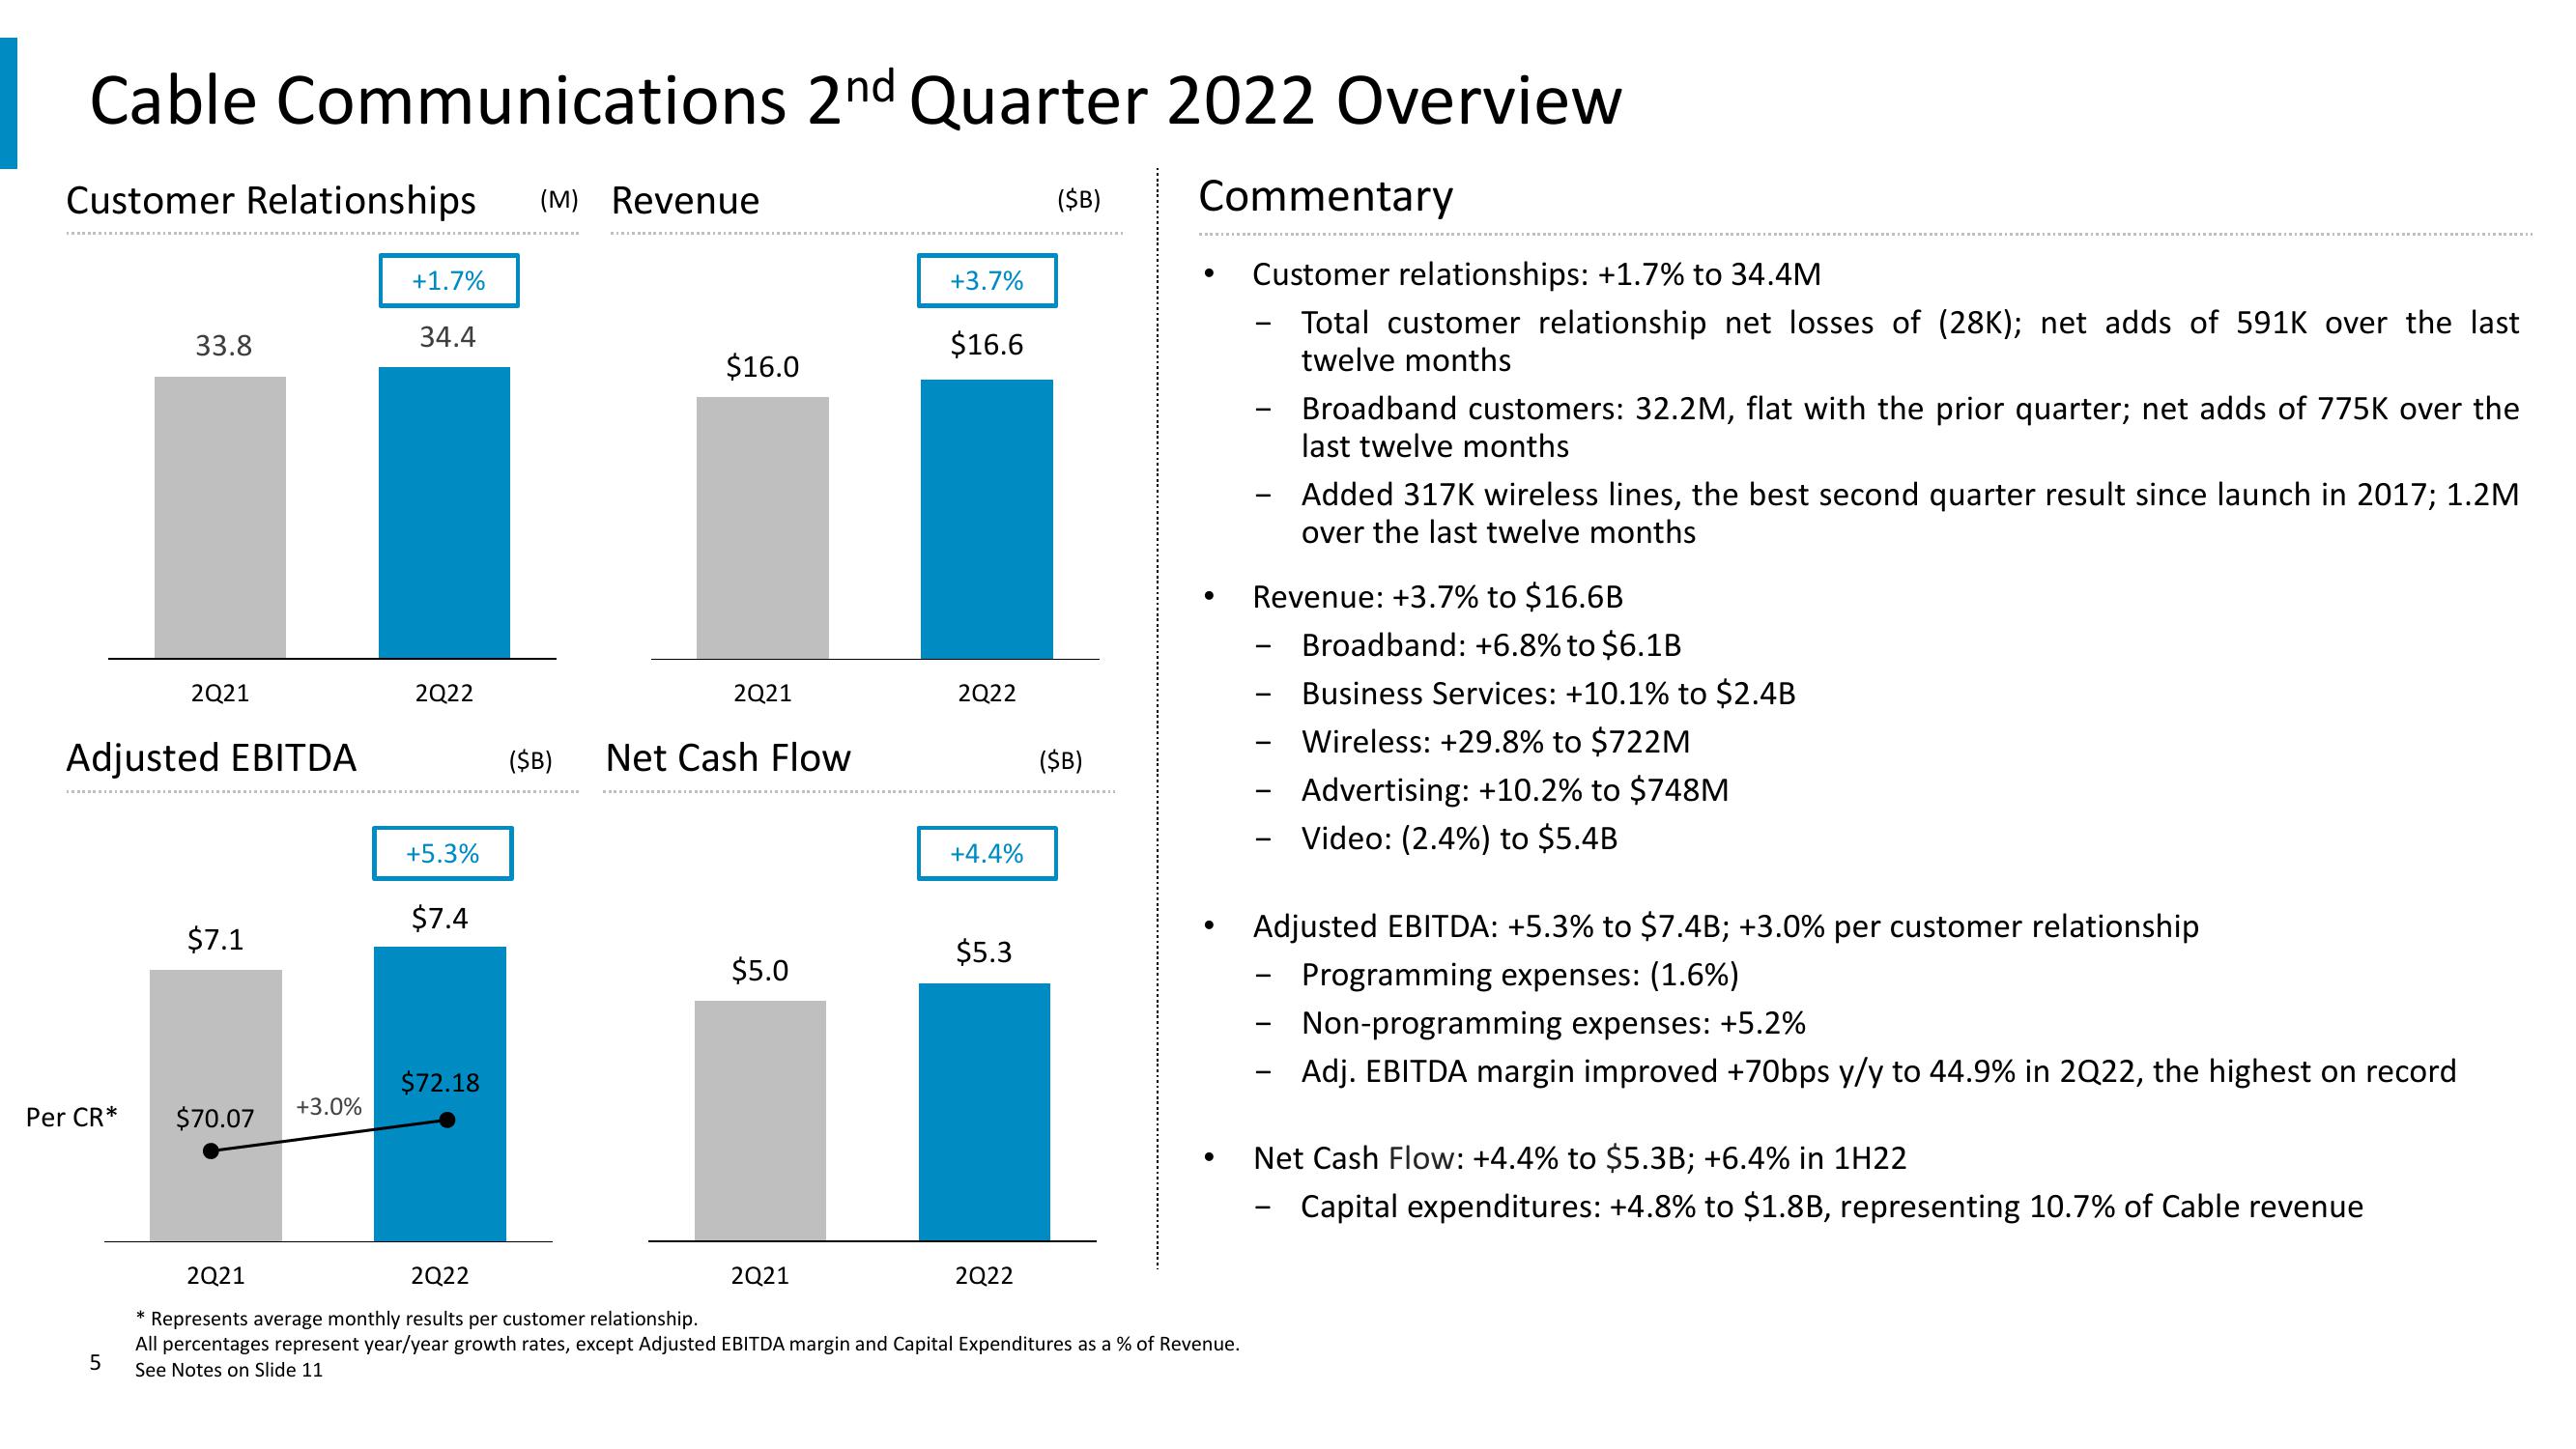
Customer relationships: +1.7% to 34.4M
Total customer relationship net losses of (28K); net adds of 591K over the last
twelve months
-
Broadband customers: 32.2M, flat with the prior quarter; net adds of 775K over the
last twelve months
Added 317K wireless lines, the best second quarter result since launch in 2017; 1.2M
over the last twelve months
Revenue: +3.7% to $16.6B
-
Broadband: +6.8% to $6.1B
Business Services: +10.1% to $2.4B
Wireless: +29.8% to $722M
Advertising: +10.2% to $748M
Video: (2.4%) to $5.4B
Adjusted EBITDA: +5.3% to $7.4B; +3.0% per customer relationship
Programming expenses: (1.6%)
Non-programming expenses: +5.2%
Adj. EBITDA margin improved +70bps y/y to 44.9% in 2Q22, the highest on record
Net Cash Flow: +4.4% to $5.3B; +6.4% in 1H22
Capital expenditures: +4.8% to $1.8B, representing 10.7% of Cable revenueView entire presentation