Comcast Results Presentation Deck
Connectivity
& Platforms
Adj.
EBITDA
Margin
5
Revenue ($B)
$20.0
3Q22
$8.0
3Q22
$20.3
Adj. EBITDA ($B)
$8.2
+100 bps
+0.2%
3Q23
+2.6%
40.6%
3Q23
($M)
Residential
Connectivity
& Platforms
Business
Services
Connectivity
3Q 2023
Revenue
y/y %
$17,951
(0.4%)
$2,320
+4.7%
3Q 2023
Adj. EBITDA
y/y%
$6,886
+2.4%
$1,335
+3.6%
●
●
●
●
●
●
●
Commentary
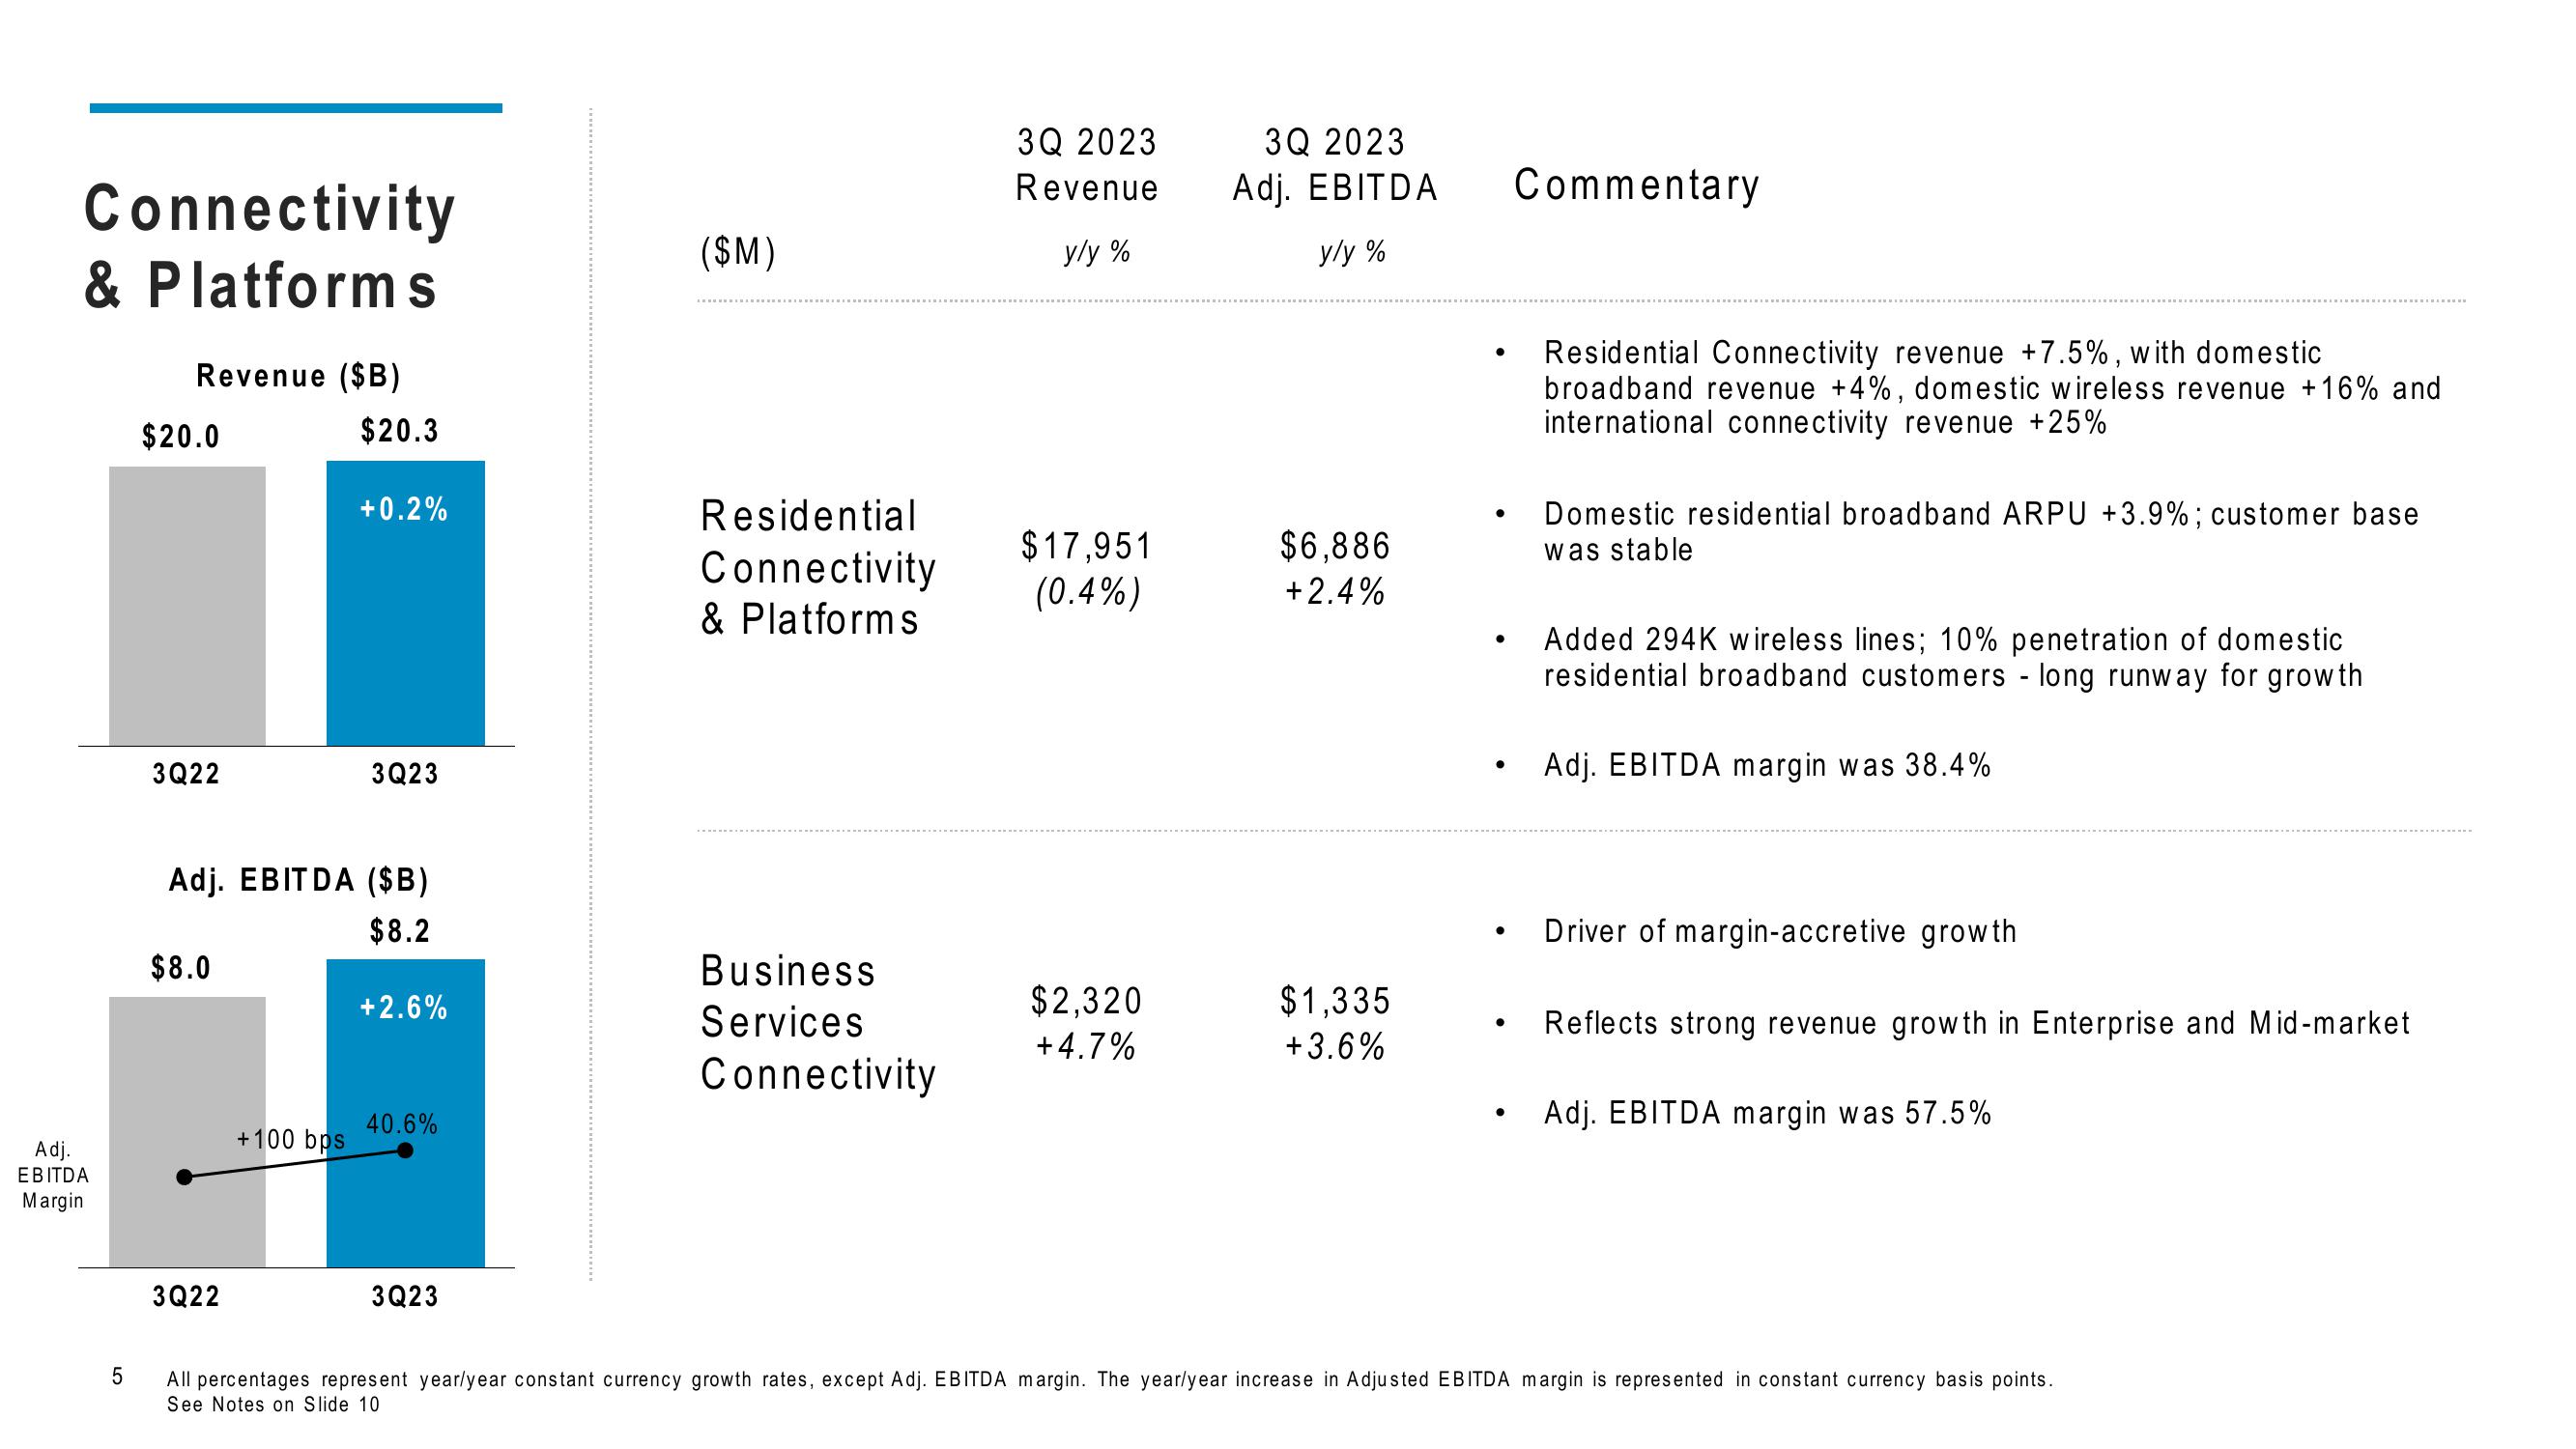
Residential Connectivity revenue +7.5%, with domestic
broadband revenue +4%, domestic wireless revenue +16% and
international connectivity revenue +25%
Domestic residential broadband ARPU +3.9%; customer base
was stable
Added 294K wireless lines; 10% penetration of domestic
residential broadband customers - long runway for growth
Adj. EBITDA margin was 38.4%
Driver of margin-accretive growth
Reflects strong revenue growth in Enterprise and Mid-market
Adj. EBITDA margin was 57.5%
All percentages represent year/year constant currency growth rates, except Adj. EBITDA margin. The year/year increase in Adjusted EBITDA margin is represented in constant currency basis points.
See Notes on Slide 10View entire presentation