Pershing Square Activist Presentation Deck
II. Pershing's View of McDonald's
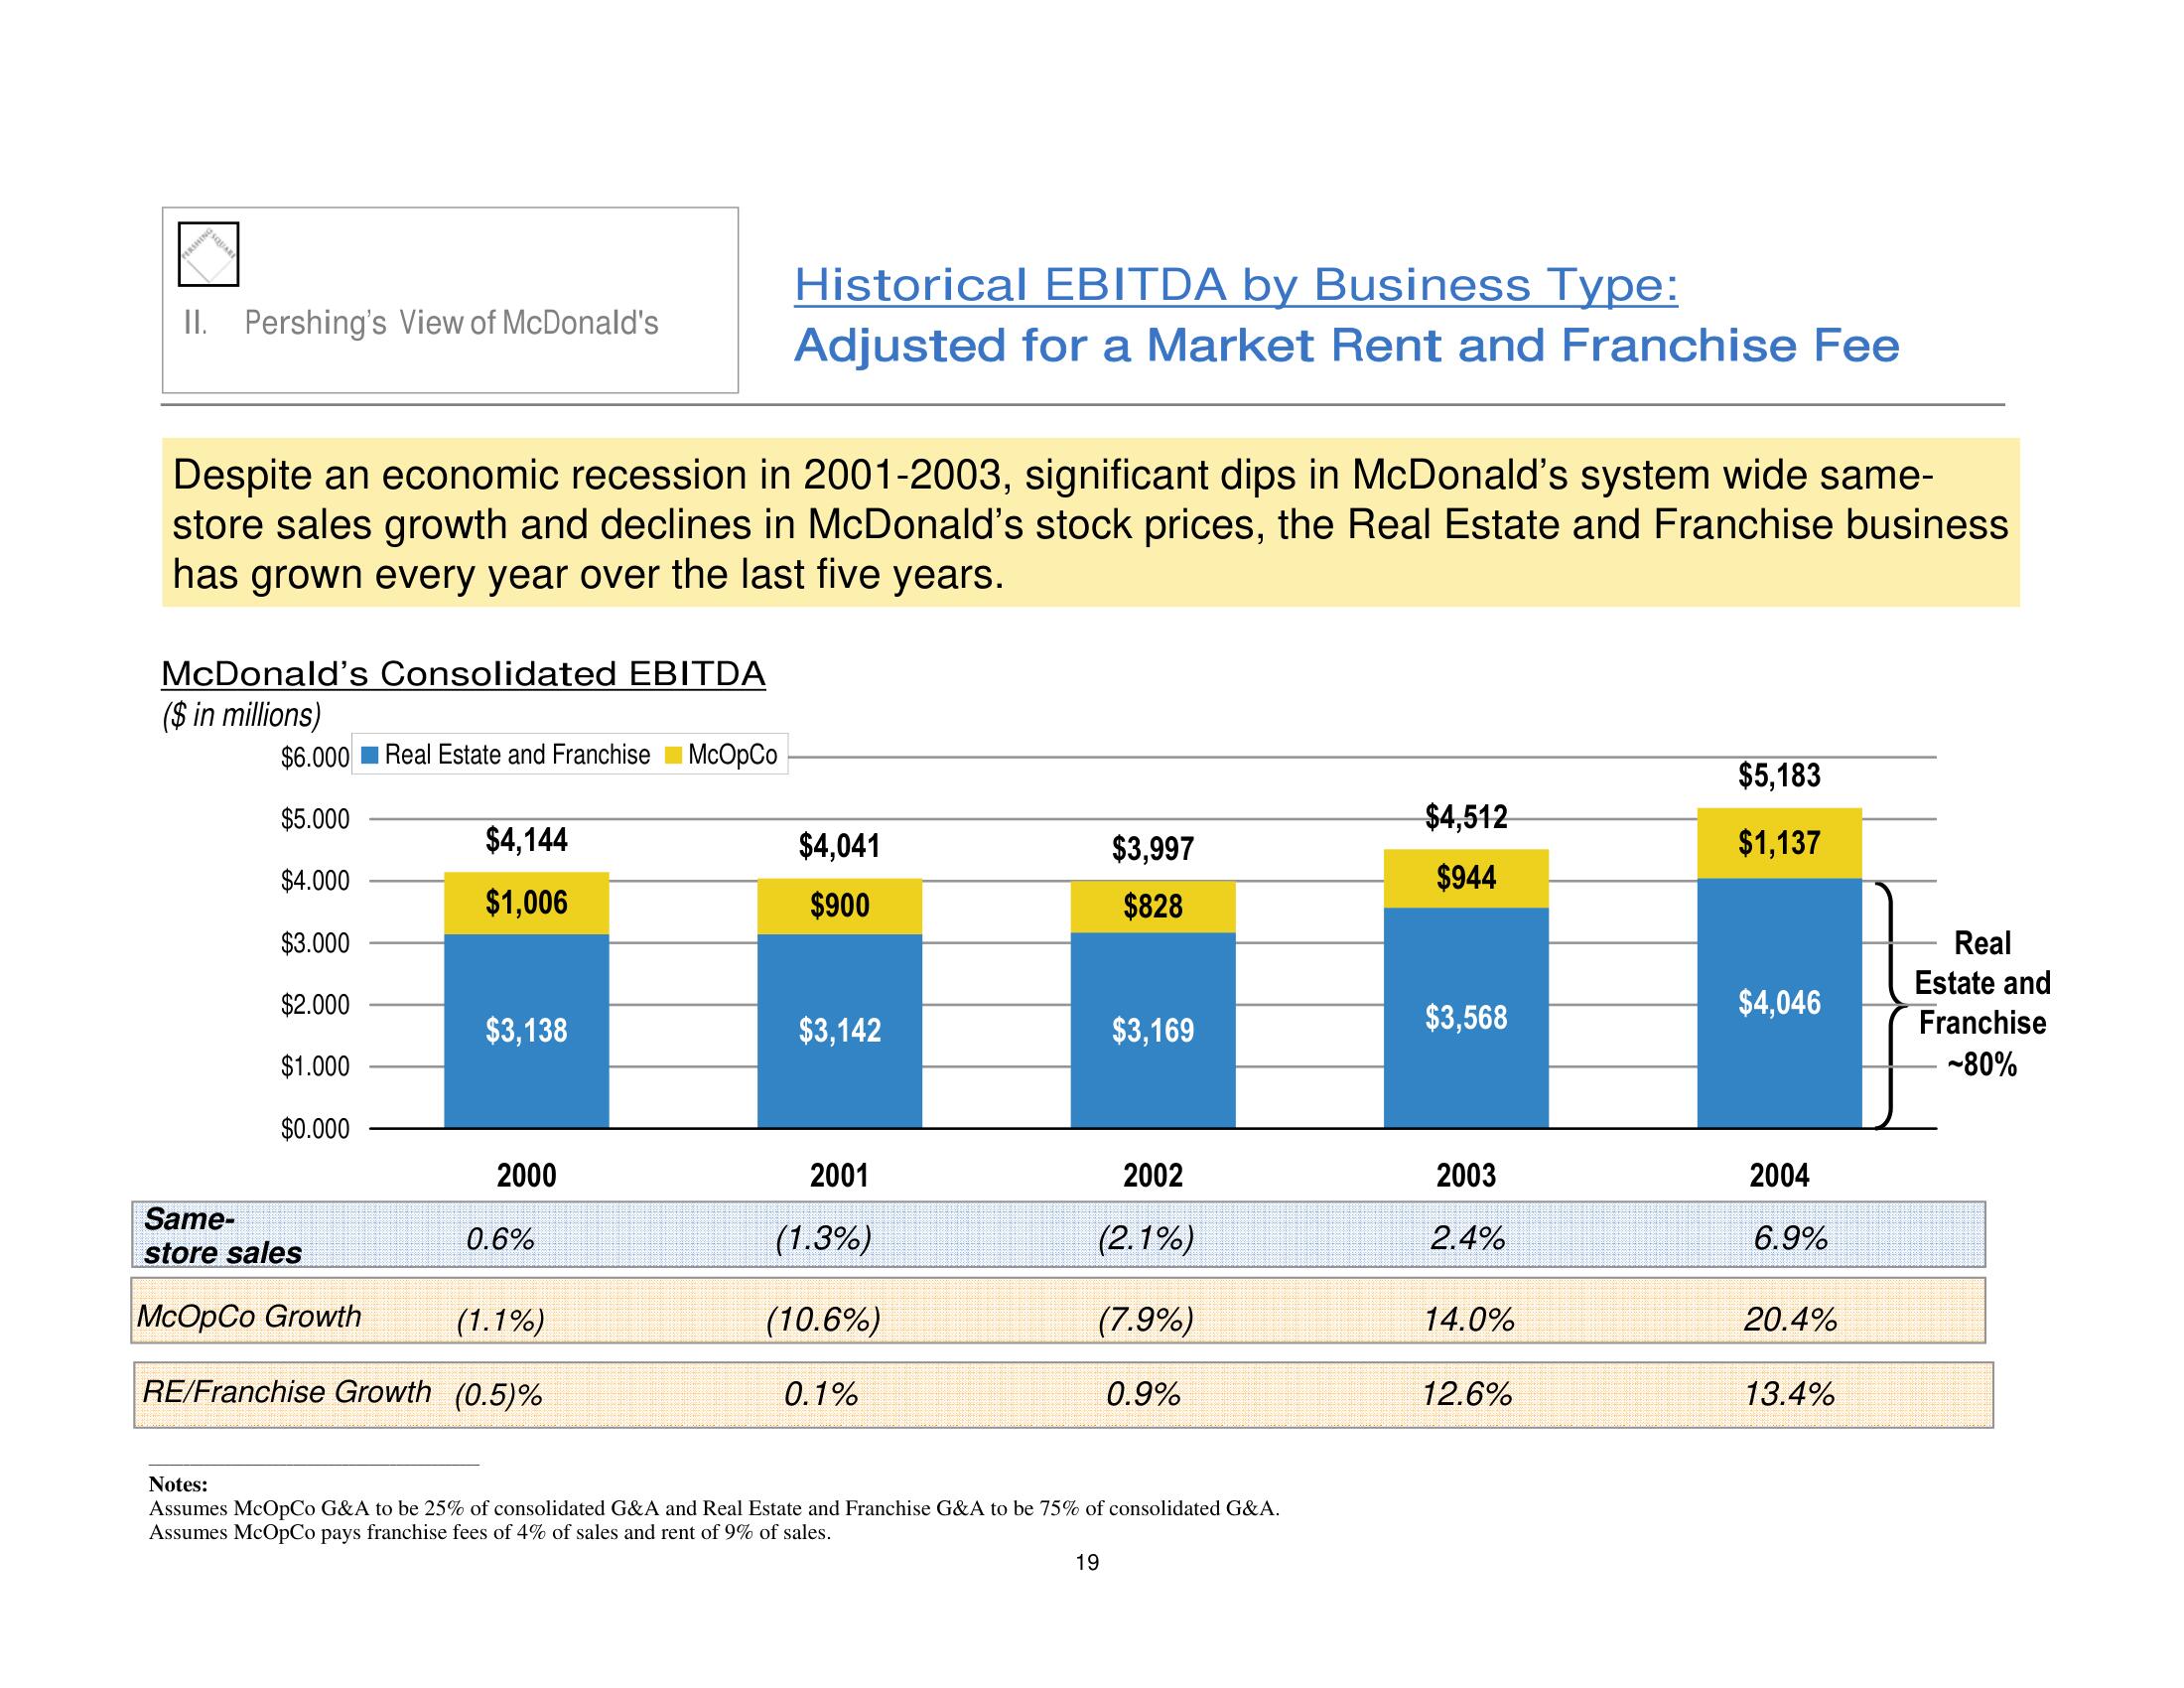
Despite an economic recession in 2001-2003, significant dips in McDonald's system wide same-
store sales growth and declines in McDonald's stock prices, the Real Estate and Franchise business
has grown every year over the last five years.
McDonald's Consolidated EBITDA
($ in millions)
$6.000
$5.000
$4.000
$3.000
$2.000
$1.000
$0.000
Same-
store sales
McOpCo Growth
Real Estate and Franchise McOpCo
$4,144
$1,006
$3,138
2000
0.6%
Historical EBITDA by Business Type:
Adjusted for a Market Rent and Franchise Fee
(1.1%)
RE/Franchise Growth (0.5)%
$4,041
$900
$3,142
2001
(1.3%)
(10.6%)
0.1%
$3,997
$828
$3,169
2002
(2.1%)
(7.9%)
0.9%
19
Notes:
Assumes McOpCo G&A to be 25% of consolidated G&A and Real Estate and Franchise G&A to be 75% of consolidated G&A.
Assumes McOpCo pays franchise fees of 4% of sales and rent of 9% of sales.
$4,512
$944
$3,568
2003
2.4%
14.0%
12.6%
$5,183
$1,137
$4,046
2004
6.9%
20.4%
13.4%
Real
Estate and
Franchise
~80%View entire presentation