Rally SPAC Presentation Deck
Middle mile trips rebound from bottom
Trips 25-250 miles long have increased from pandemic lows
Trips 25-250 miles within the USA¹
Trips 25-250 miles vs. Day
Trips 25-250 miles
125.0M
100.0M
75.0M
50.0M
25.0M
0.0M
1-Jan-20
1-Jul-20
Compound monthly
growth rate = 20.72%
1-Jul-21
1-Jan-21
Day
1-Jan-22
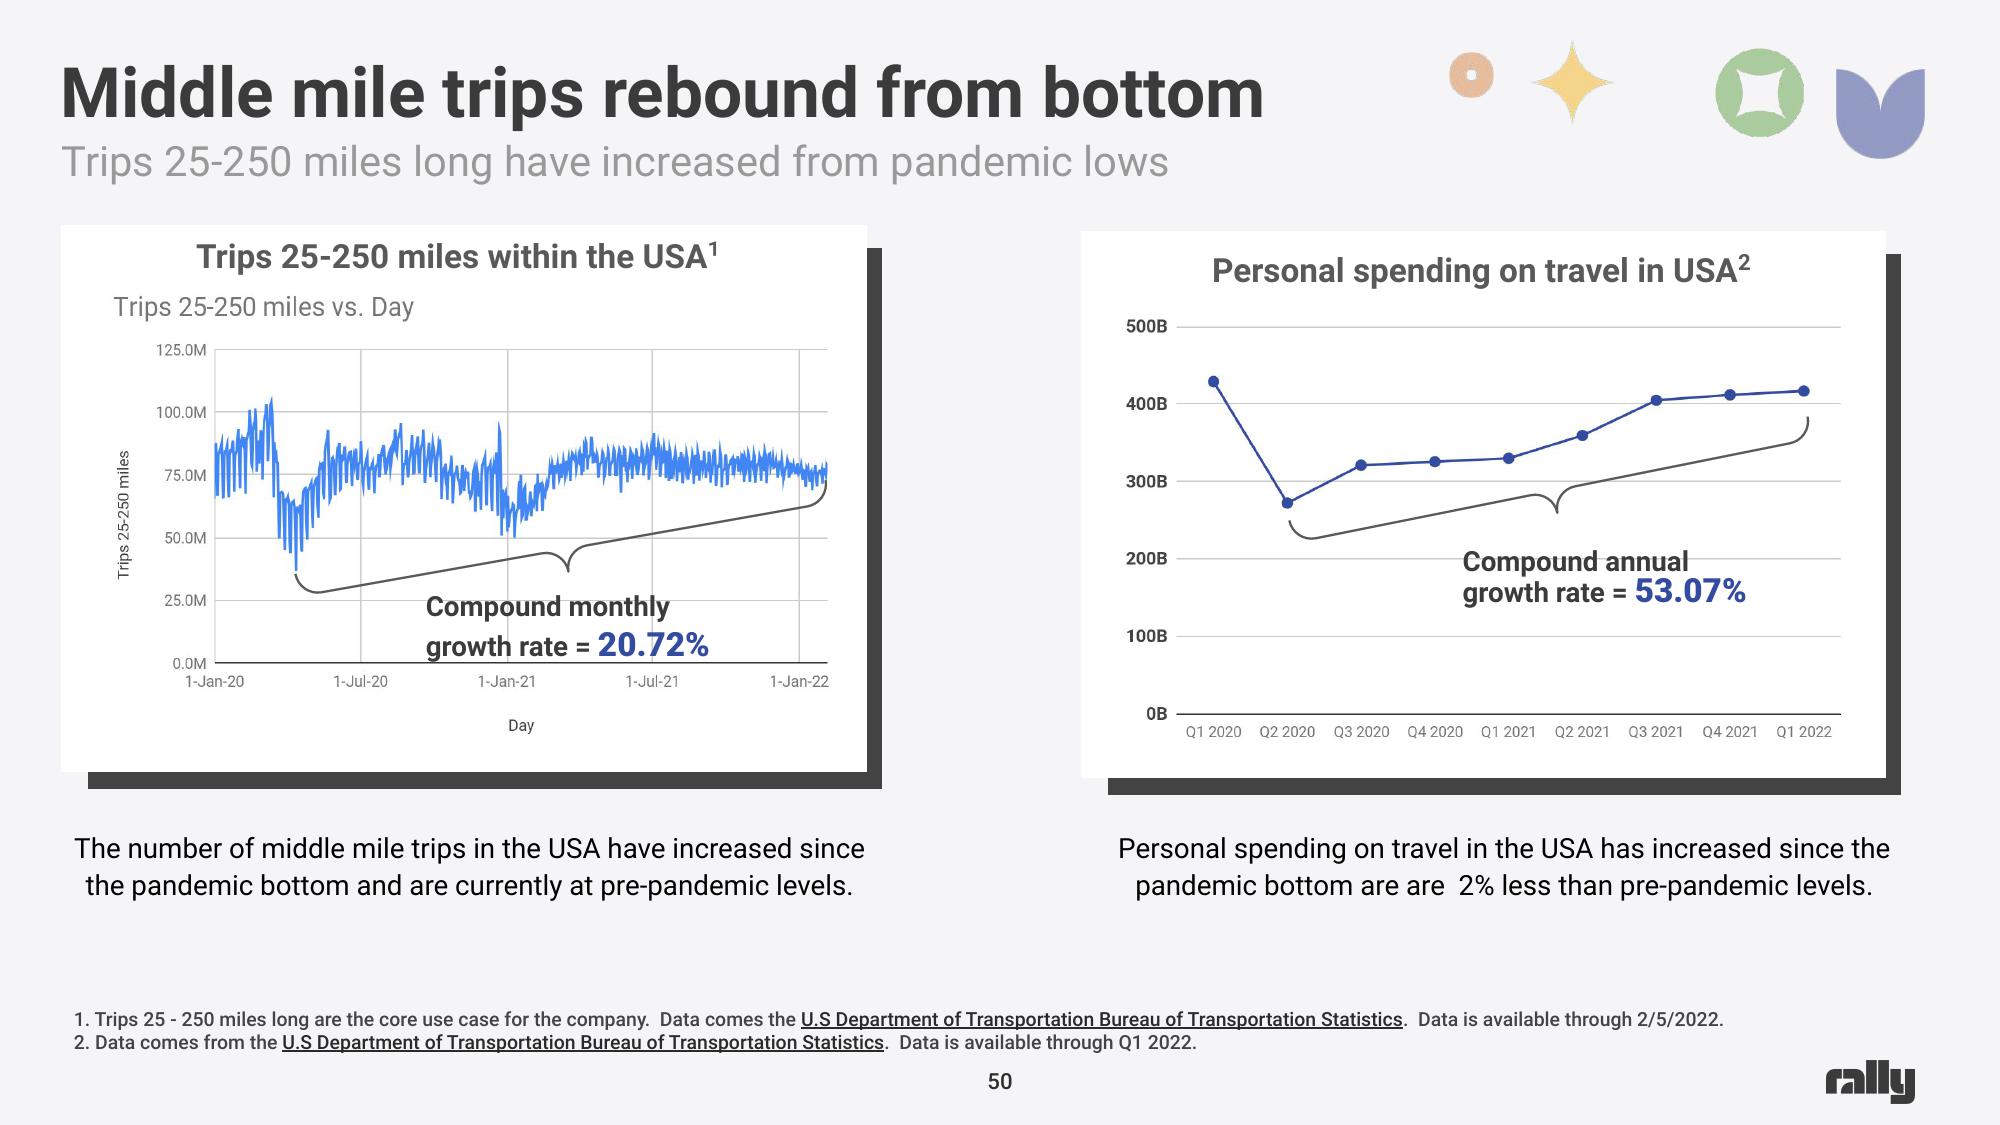
The number of middle mile trips in the USA have increased since
the pandemic bottom and are currently at pre-pandemic levels.
500B
400B
300B
200B
100B
OB
Personal spending on travel in USA²
Compound annual
growth rate= = 53.07%
Q1 2020 Q2 2020 Q3 2020 Q4 2020 Q1 2021
Q2 2021 Q3 2021 Q4 2021 Q1 2022
Personal spending on travel in the USA has increased since the
pandemic bottom are are 2% less than pre-pandemic levels.
1. Trips 25 - 250 miles long are the core use case for the company. Data comes the U.S Department of Transportation Bureau of Transportation Statistics. Data is available through 2/5/2022.
2. Data comes from the U.S Department of Transportation Bureau of Transportation Statistics. Data is available through Q1 2022.
50
rallyView entire presentation