Silicon Valley Bank Results Presentation Deck
Strong balance sheet growth driving NII with
NIM headwinds (1 of 2)
INTEREST-EARNING ASSETS
Billions
Loans,
net of
unearned
income
4.85%
$21.2
Cash &
Equiv.
svb>
4.22%
2017
Fixed
Income 1.88%
Securities
$25.5
$25.6
5.3%
4.77%
2018
$27.6
2.36%
$28.4
2018
5.63%
5.10%
$26.6
2.58%
$29.4
5.65% Overall
Q1 2019 Q2 2019
Q2 2019 Corporate Overview and Financial Results
5.01%
$28.5
2.57%
Loan Yield
Loan Yield
net of fees
and interest
recoveries
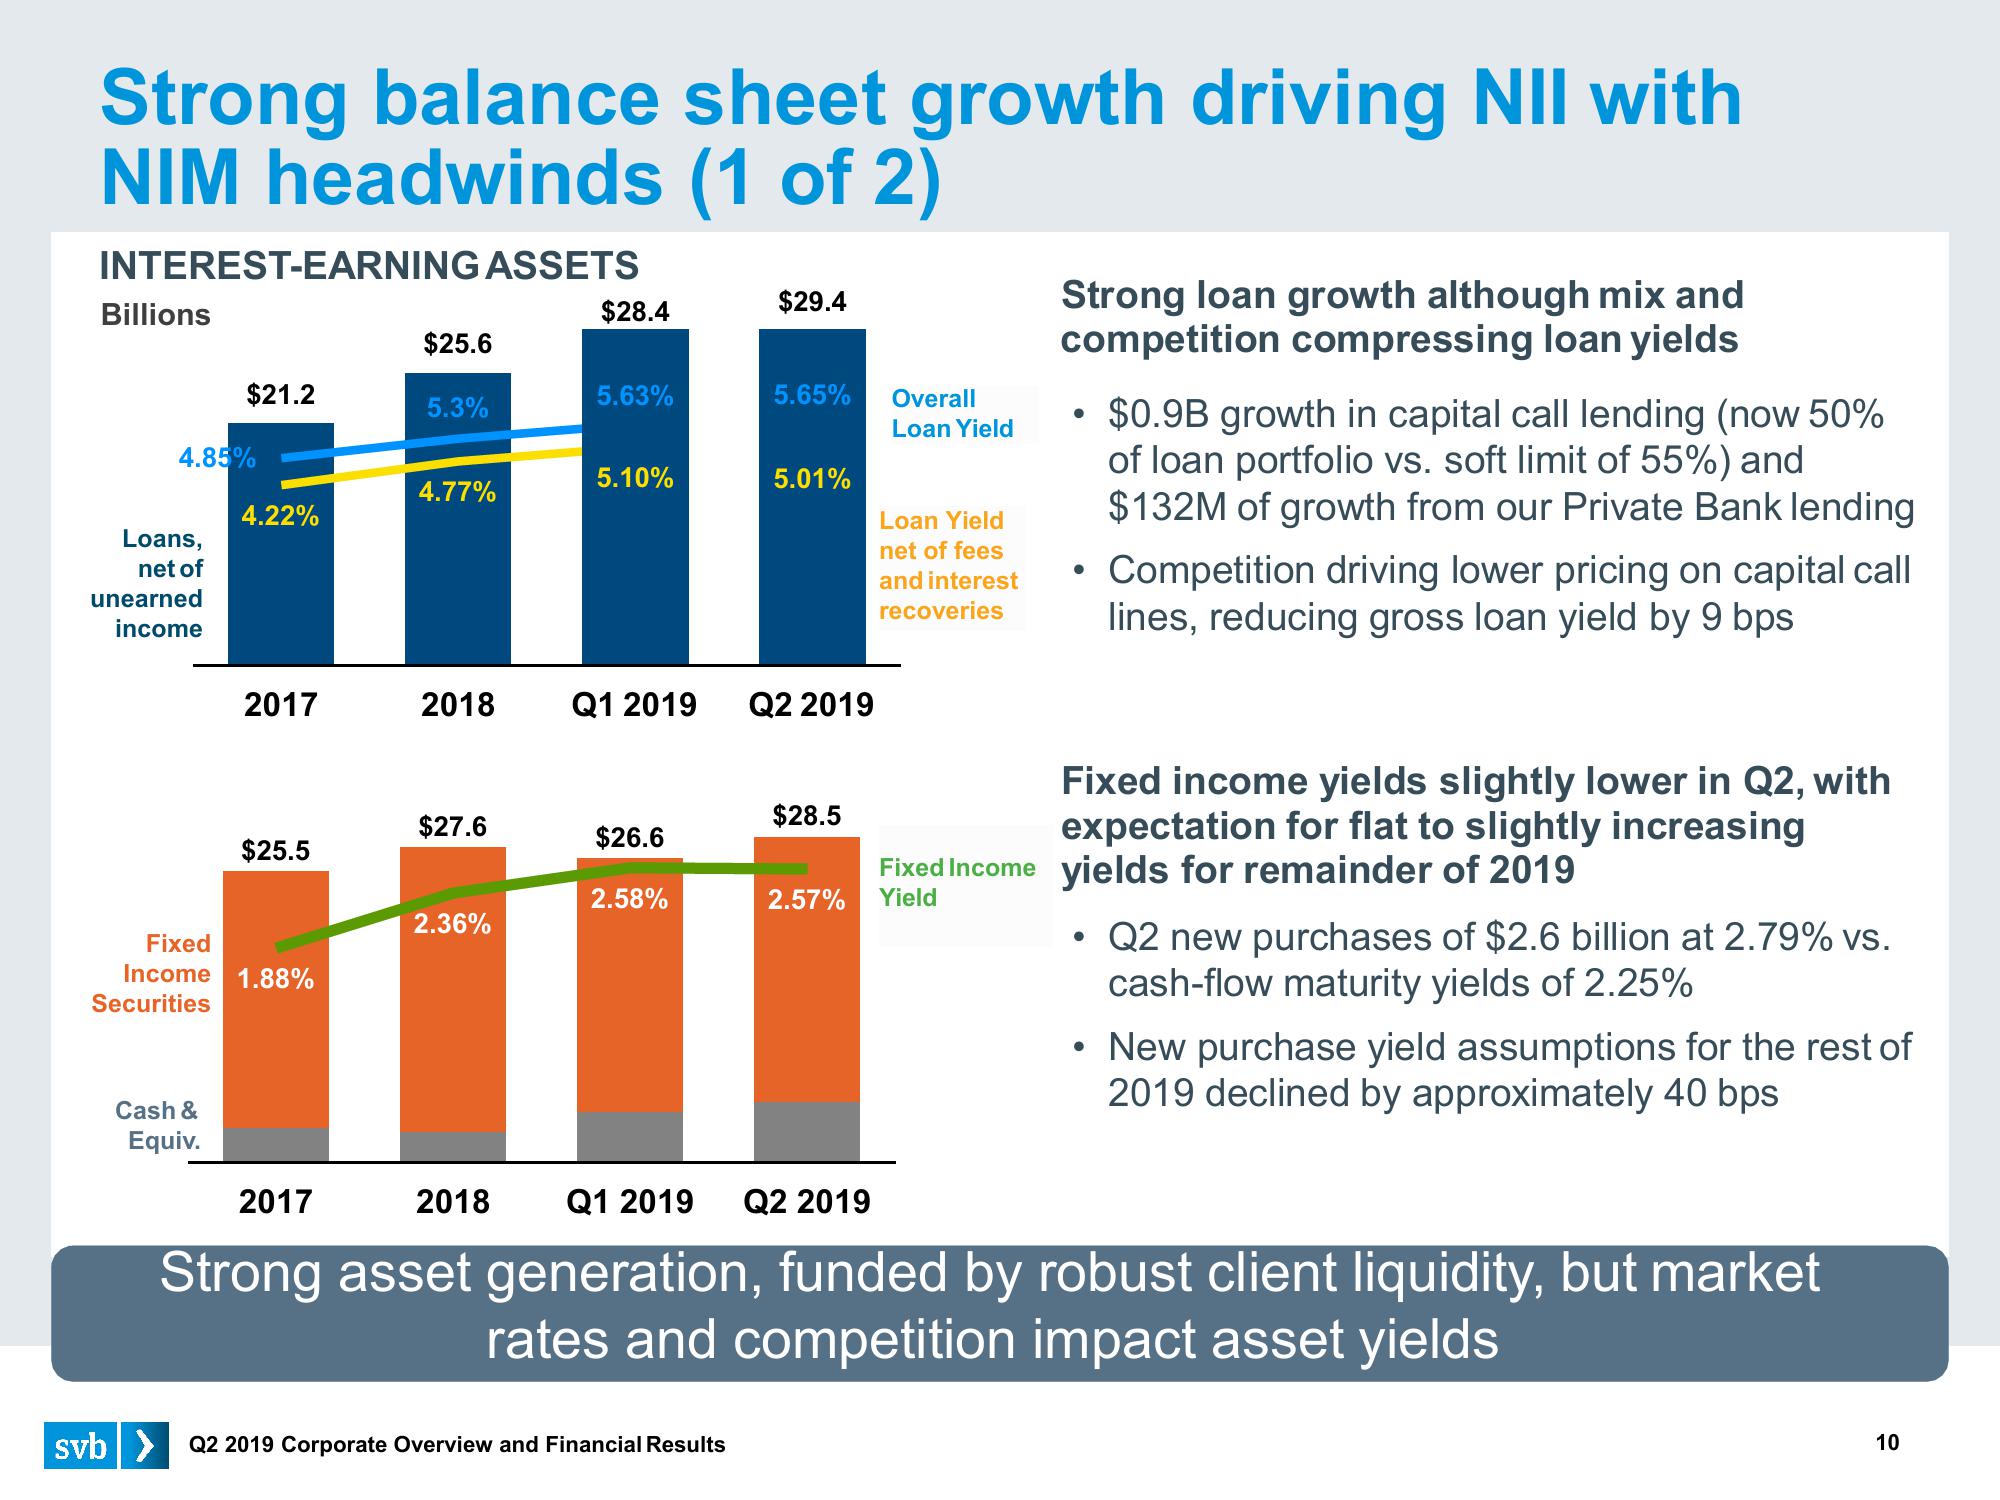
Strong loan growth although mix and
competition compressing loan yields
●
$0.9B growth in capital call lending (now 50%
of loan portfolio vs. soft limit of 55%) and
$132M of growth from our Private Bank lending
• Competition driving lower pricing on capital call
lines, reducing gross loan yield by 9 bps
Fixed income yields slightly lower in Q2, with
expectation for flat to slightly increasing
Fixed Income yields for remainder of 2019
Yield
●
Q2 new purchases of $2.6 billion at 2.79% vs.
cash-flow maturity yields of 2.25%
2017
Q1 2019 Q2 2019
Strong asset generation, funded by robust client liquidity, but market
rates and competition impact asset yields
• New purchase yield assumptions for the rest of
2019 declined by approximately 40 bps
10View entire presentation