Main Street Capital Fixed Income Presentation Deck
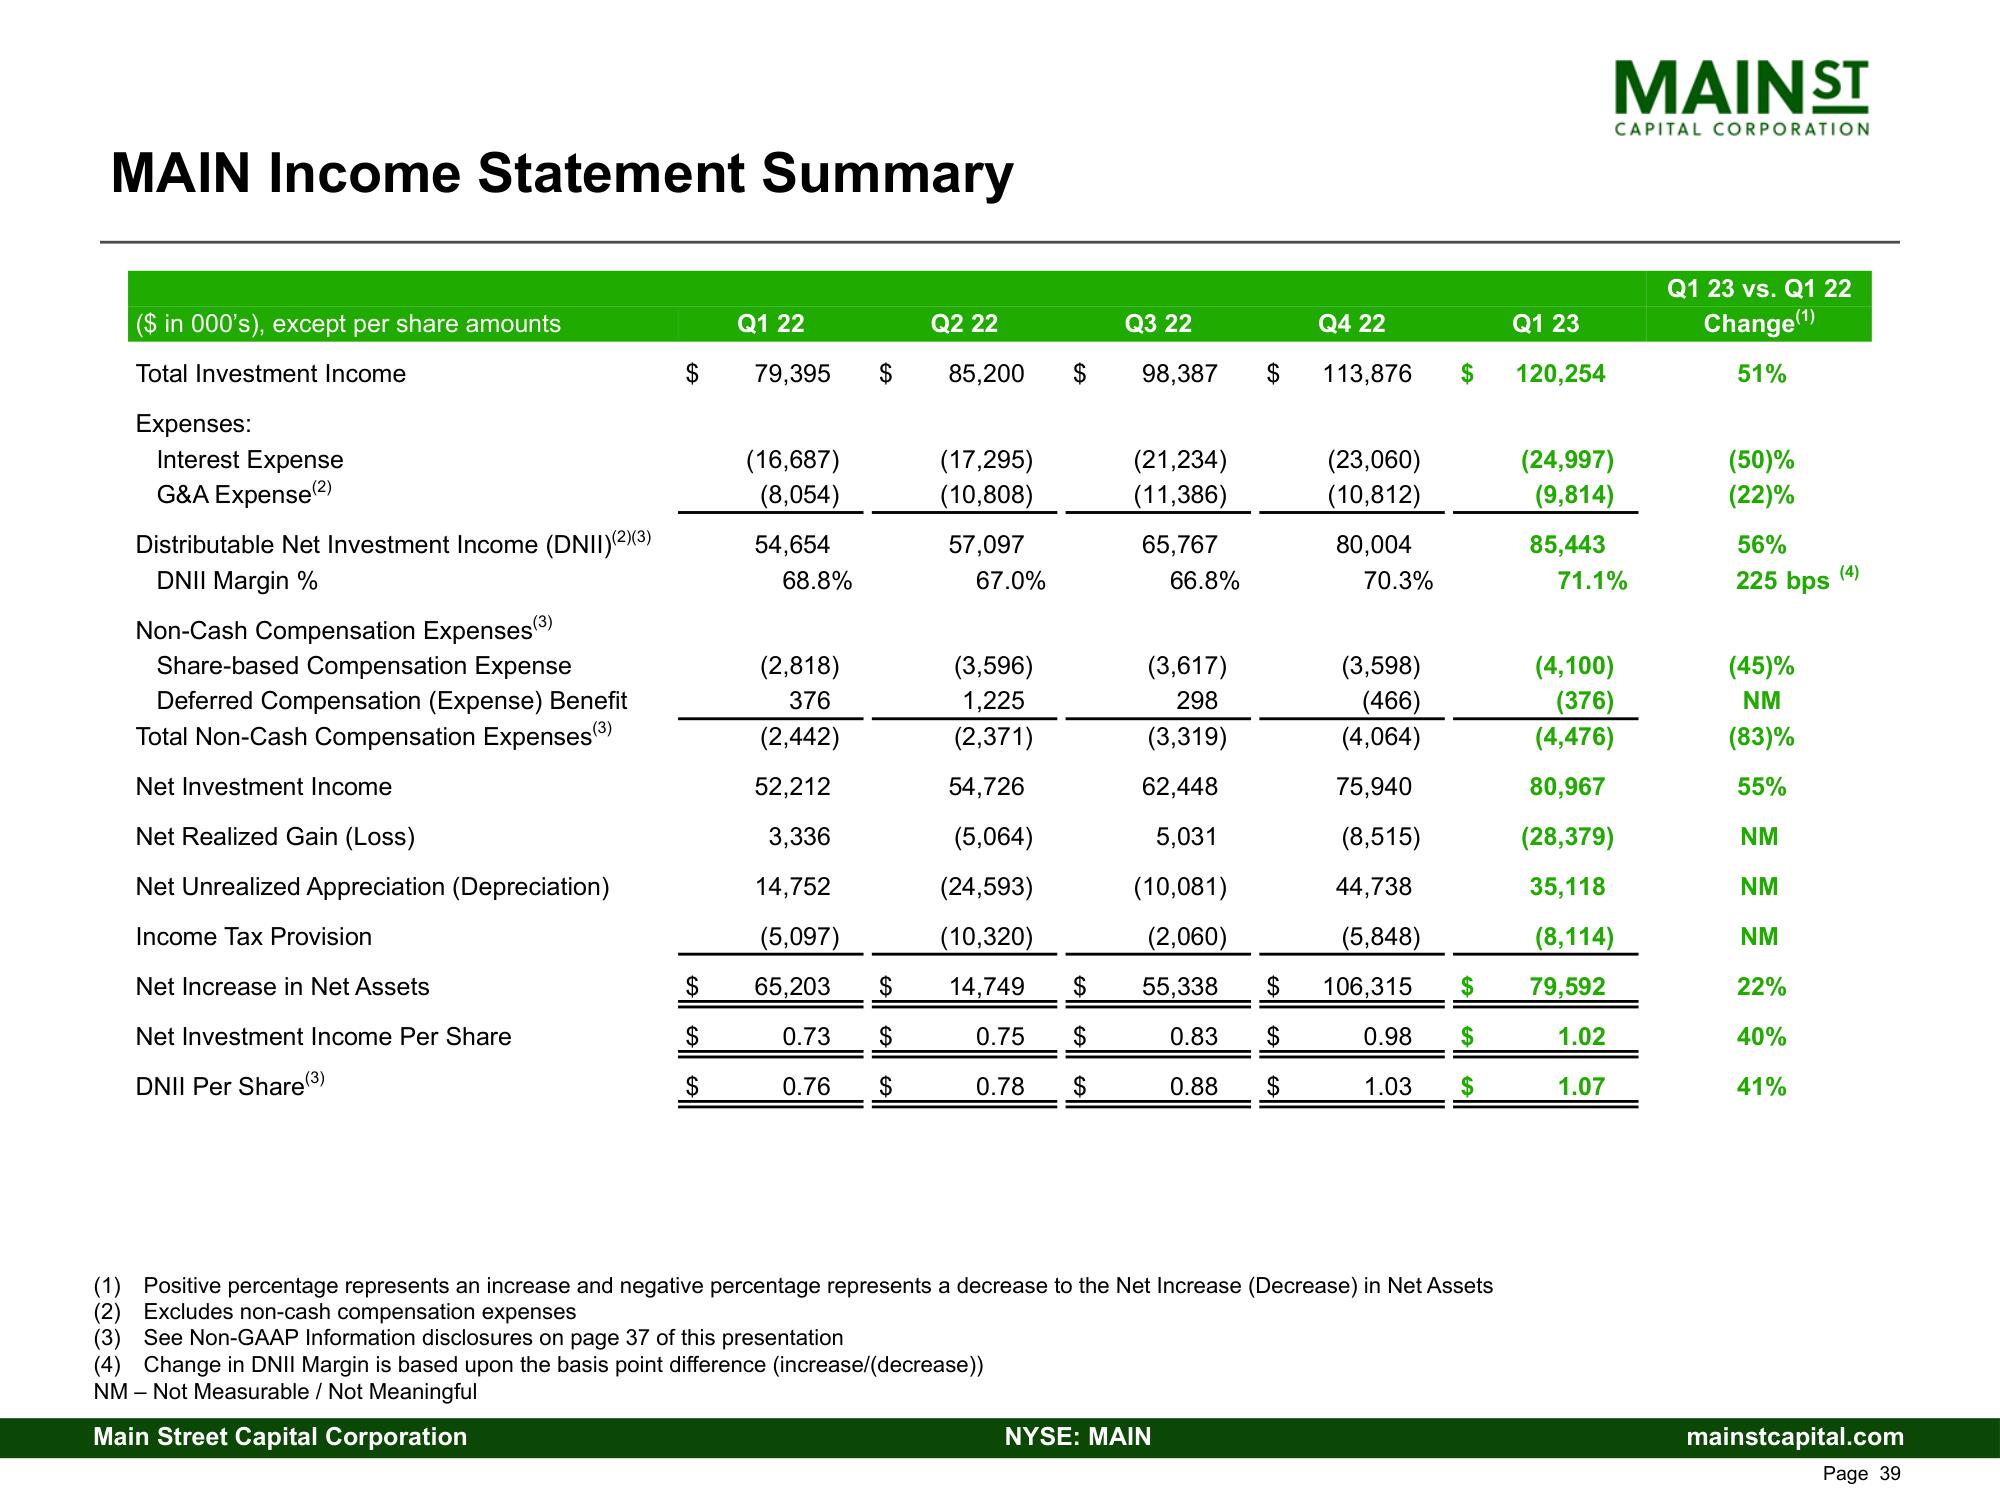
MAIN Income Statement Summary
($ in 000's), except per share amounts
Total Investment Income
Expenses:
Interest Expense
G&A Expense (2)
Distributable Net Investment Income (DNII)(2)(3)
DNII Margin %
Non-Cash Compensation Expenses (³)
Share-based Compensation Expense
Deferred Compensation (Expense) Benefit
Total Non-Cash Compensation Expenses(³)
Net Investment Income
Net Realized Gain (Loss)
Net Unrealized Appreciation (Depreciation)
Income Tax Provision
Net Increase in Net Assets
Net Investment Income Per Share
DNII Per Share (³)
Q1 22
79,395
(16,687)
(8,054)
54,654
68.8%
(2,818)
376
(2,442)
52,212
3,336
14,752
(5,097)
$ 65,203
$
$
$
$
0.73 $
0.76 $
Q2 22
85,200
(17,295)
(10,808)
57,097
67.0%
(3,596)
1,225
(2,371)
54,726
$
(5,064)
(24,593)
(10,320)
14,749
0.75
0.78 $
$
Q3 22
98,387
(21,234)
(11,386)
65,767
66.8%
$
NYSE: MAIN
Q4 22
113,876
(23,060)
(10,812)
80,004
70.3%
(3,598)
(466)
(4,064)
75,940
(3,617)
298
(3,319)
62,448
5,031
(5,848)
(10,081)
(2,060)
55,338 $ 106,315
0.83 $
0.98 $
0.88 $
1.03
$
$
(8,515)
44,738
Positive percentage represents an increase and negative percentage represents a decrease to the Net Increase (Decrease) in Net Assets
(2) Excludes non-cash compensation expenses
(3) See Non-GAAP Information disclosures on page 37 of this presentation
(4) Change in DNII Margin is based upon the basis point difference (increase/(decrease))
NM - Not Measurable / Not Meaningful
Main Street Capital Corporation
Q1 23
120,254
MAIN ST
85,443
CAPITAL CORPORATION
(24,997)
(9,814)
(4,100)
(376)
(4,476)
80,967
(28,379)
35,118
(8,114)
$ 79,592
1.02
1.07
71.1%
Q1 23 vs. Q1 22
Change (¹)
51%
(50)%
(22)%
56%
225 bps
(45)%
NM
(83)%
55%
NM
NM
NM
22%
40%
41%
(4)
mainstcapital.com
Page 39View entire presentation