Goldman Sachs Results Presentation Deck
Asset & Wealth Management - Alternative Investments
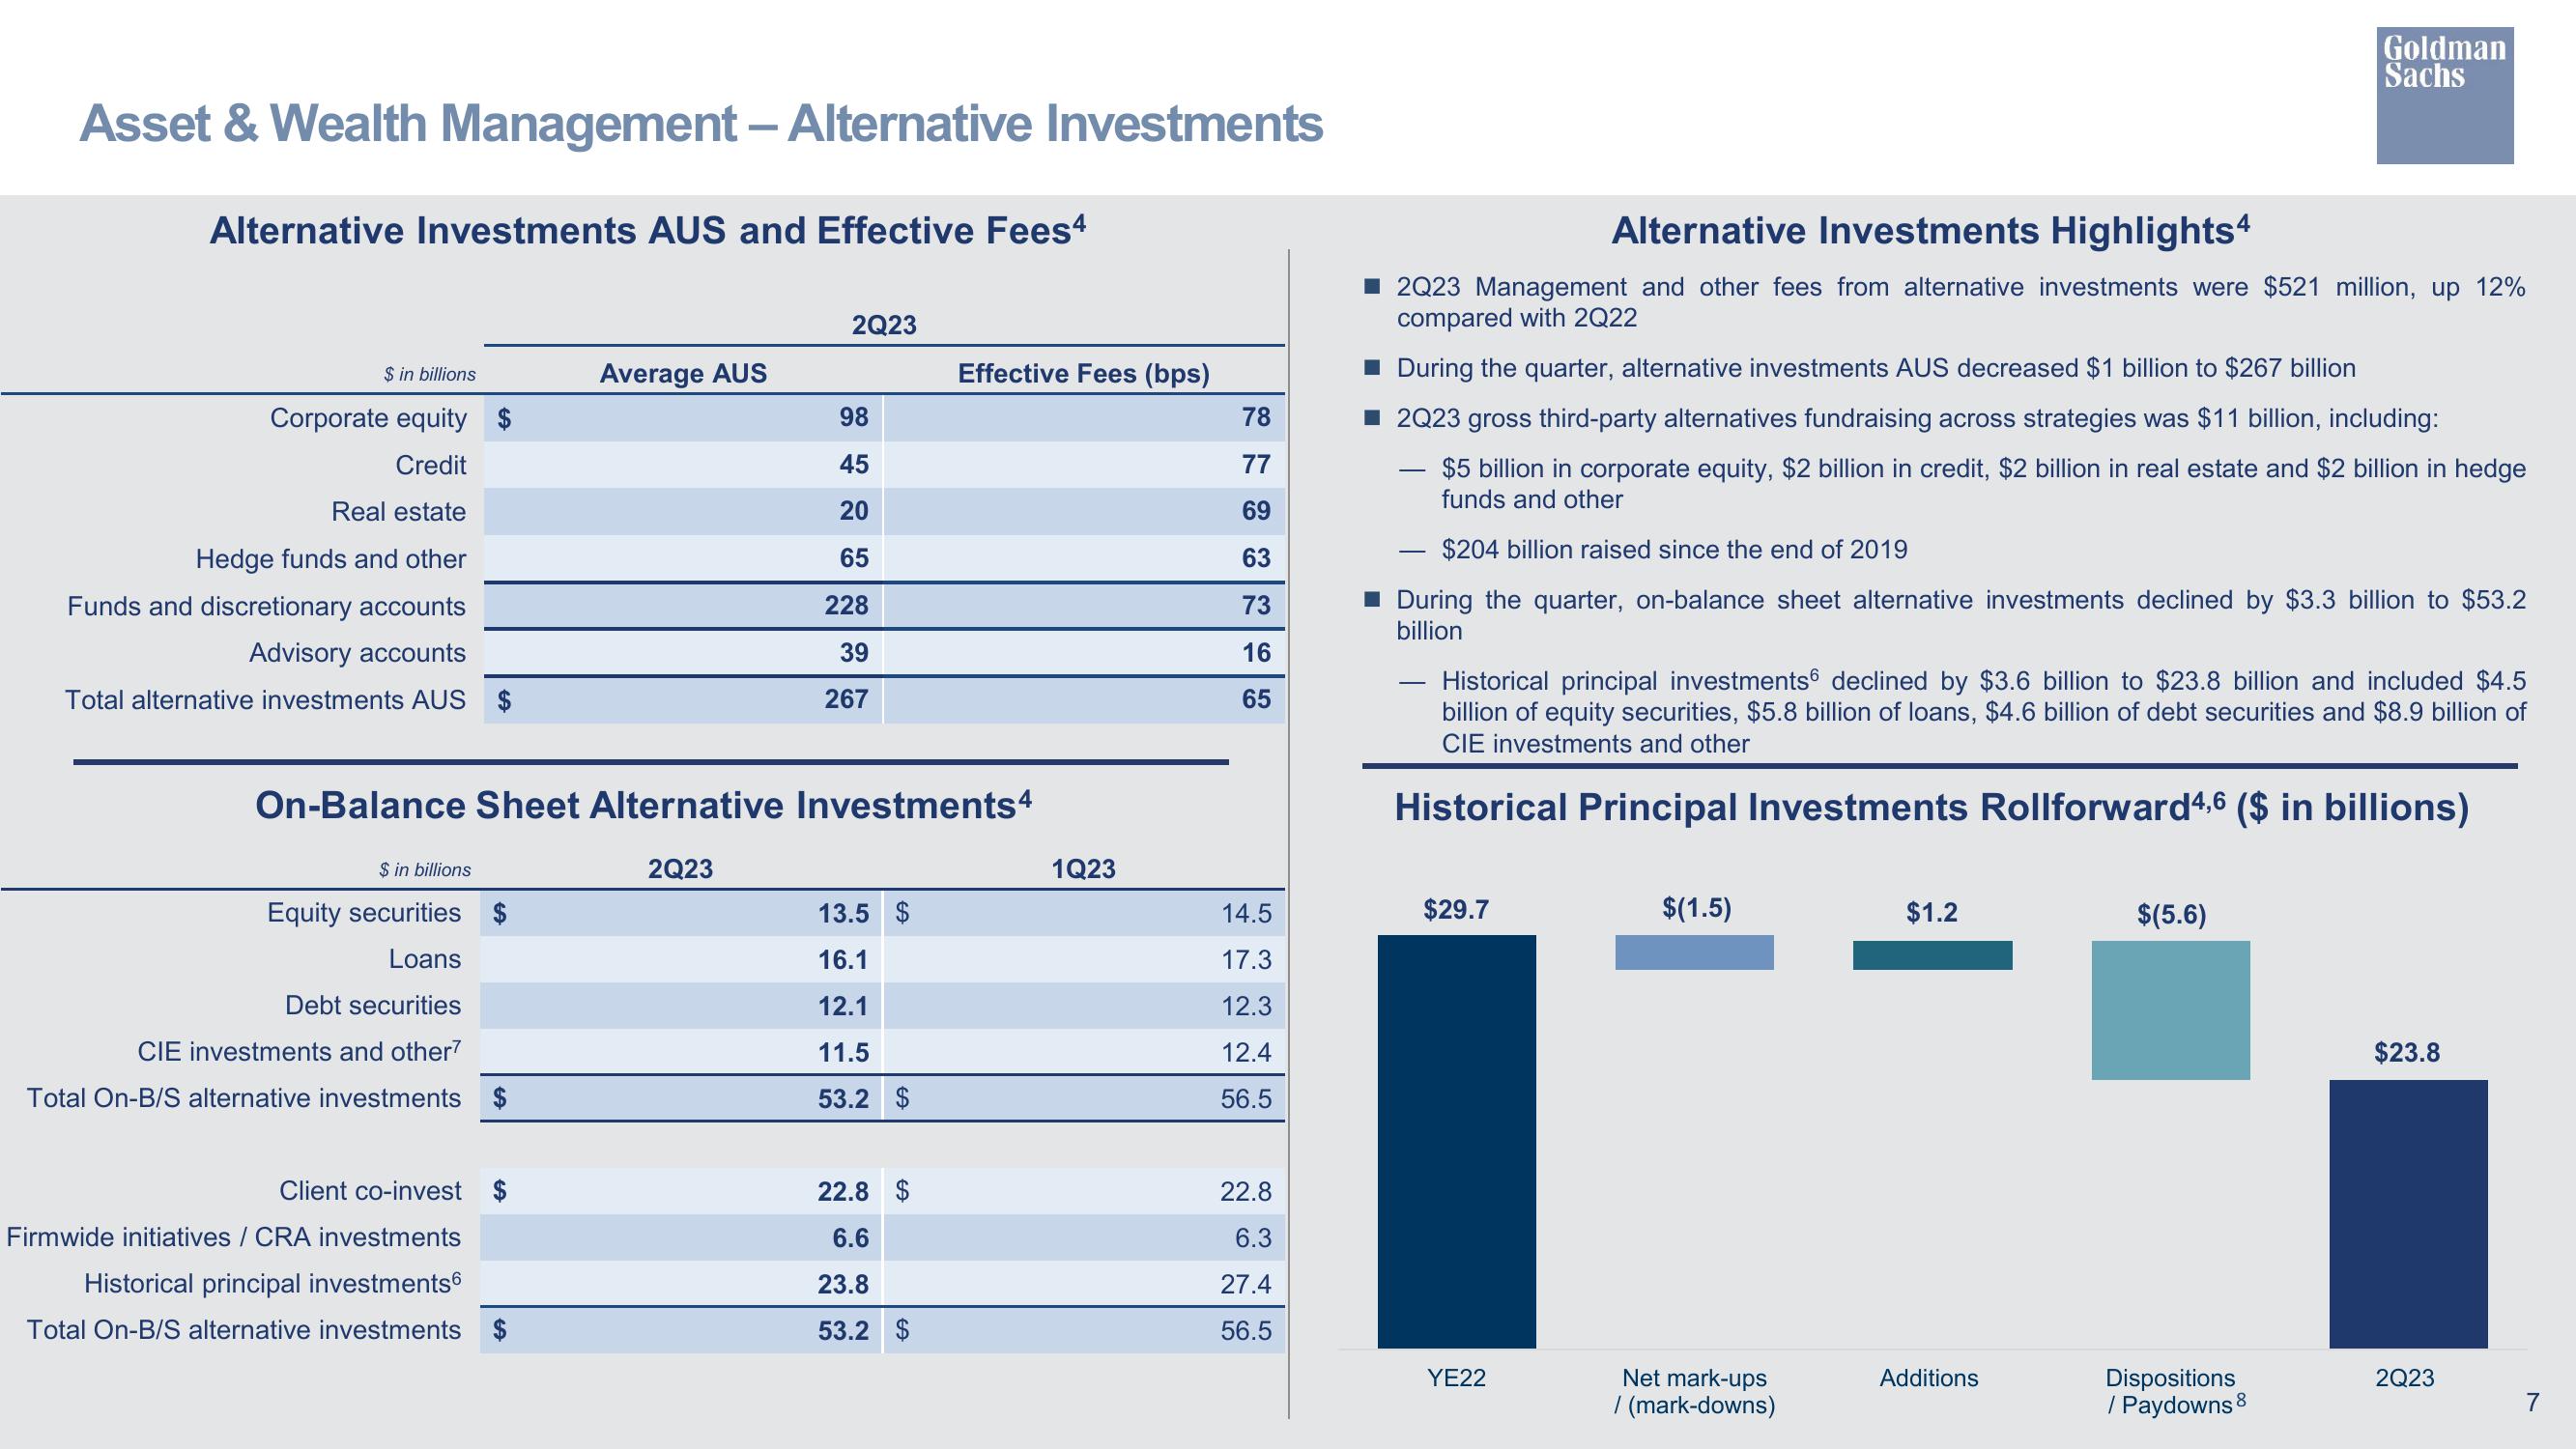
Alternative Investments AUS and Effective Fees4
$ in billions
Corporate equity
Credit
Real estate
Hedge funds and other
Funds and discretionary accounts
Advisory accounts
Total alternative investments AUS $
$ in billions
Equity securities
Loans
Debt securities
CIE investments and other7
Total On-B/S alternative investments
Average AUS
Client co-invest
Firmwide initiatives / CRA investments
Historical principal investments
Total On-B/S alternative investments
2Q23
On-Balance Sheet Alternative Investments4
2Q23
98
45
20
65
228
39
267
13.5 $
16.1
12.1
11.5
53.2 $
Effective Fees (bps)
22.8 $
6.6
23.8
53.2 $
1Q23
78
77
69
63
73 16 65
14.5
17.3
12.3
12.4
56.5
22.8
6.3
27.4
56.5
Alternative Investments Highlights4
2Q23 Management and other fees from alternative investments were $521 million, up 12%
compared with 2Q22
■ During the quarter, alternative investments AUS decreased $1 billion to $267 billion
2Q23 gross third-party alternatives fundraising across strategies was $11 billion, including:
$5 billion in corporate equity, $2 billion in credit, $2 billion in real estate and $2 billion in hedge
funds and other
$204 billion raised since the end of 2019
During the quarter, on-balance sheet alternative investments declined by $3.3 billion to $53.2
billion
Historical principal investments6 declined by $3.6 billion to $23.8 billion and included $4.5
billion of equity securities, $5.8 billion of loans, $4.6 billion of debt securities and $8.9 billion of
CIE investments and other
Historical Principal Investments Rollforward 4,6 ($ in billions)
$29.7
YE22
$(1.5)
Net mark-ups
/ (mark-downs)
$1.2
Additions
Goldman
Sachs
$(5.6)
Dispositions
/ Paydowns 8
$23.8
2Q23
7View entire presentation