Affirm Results Presentation Deck
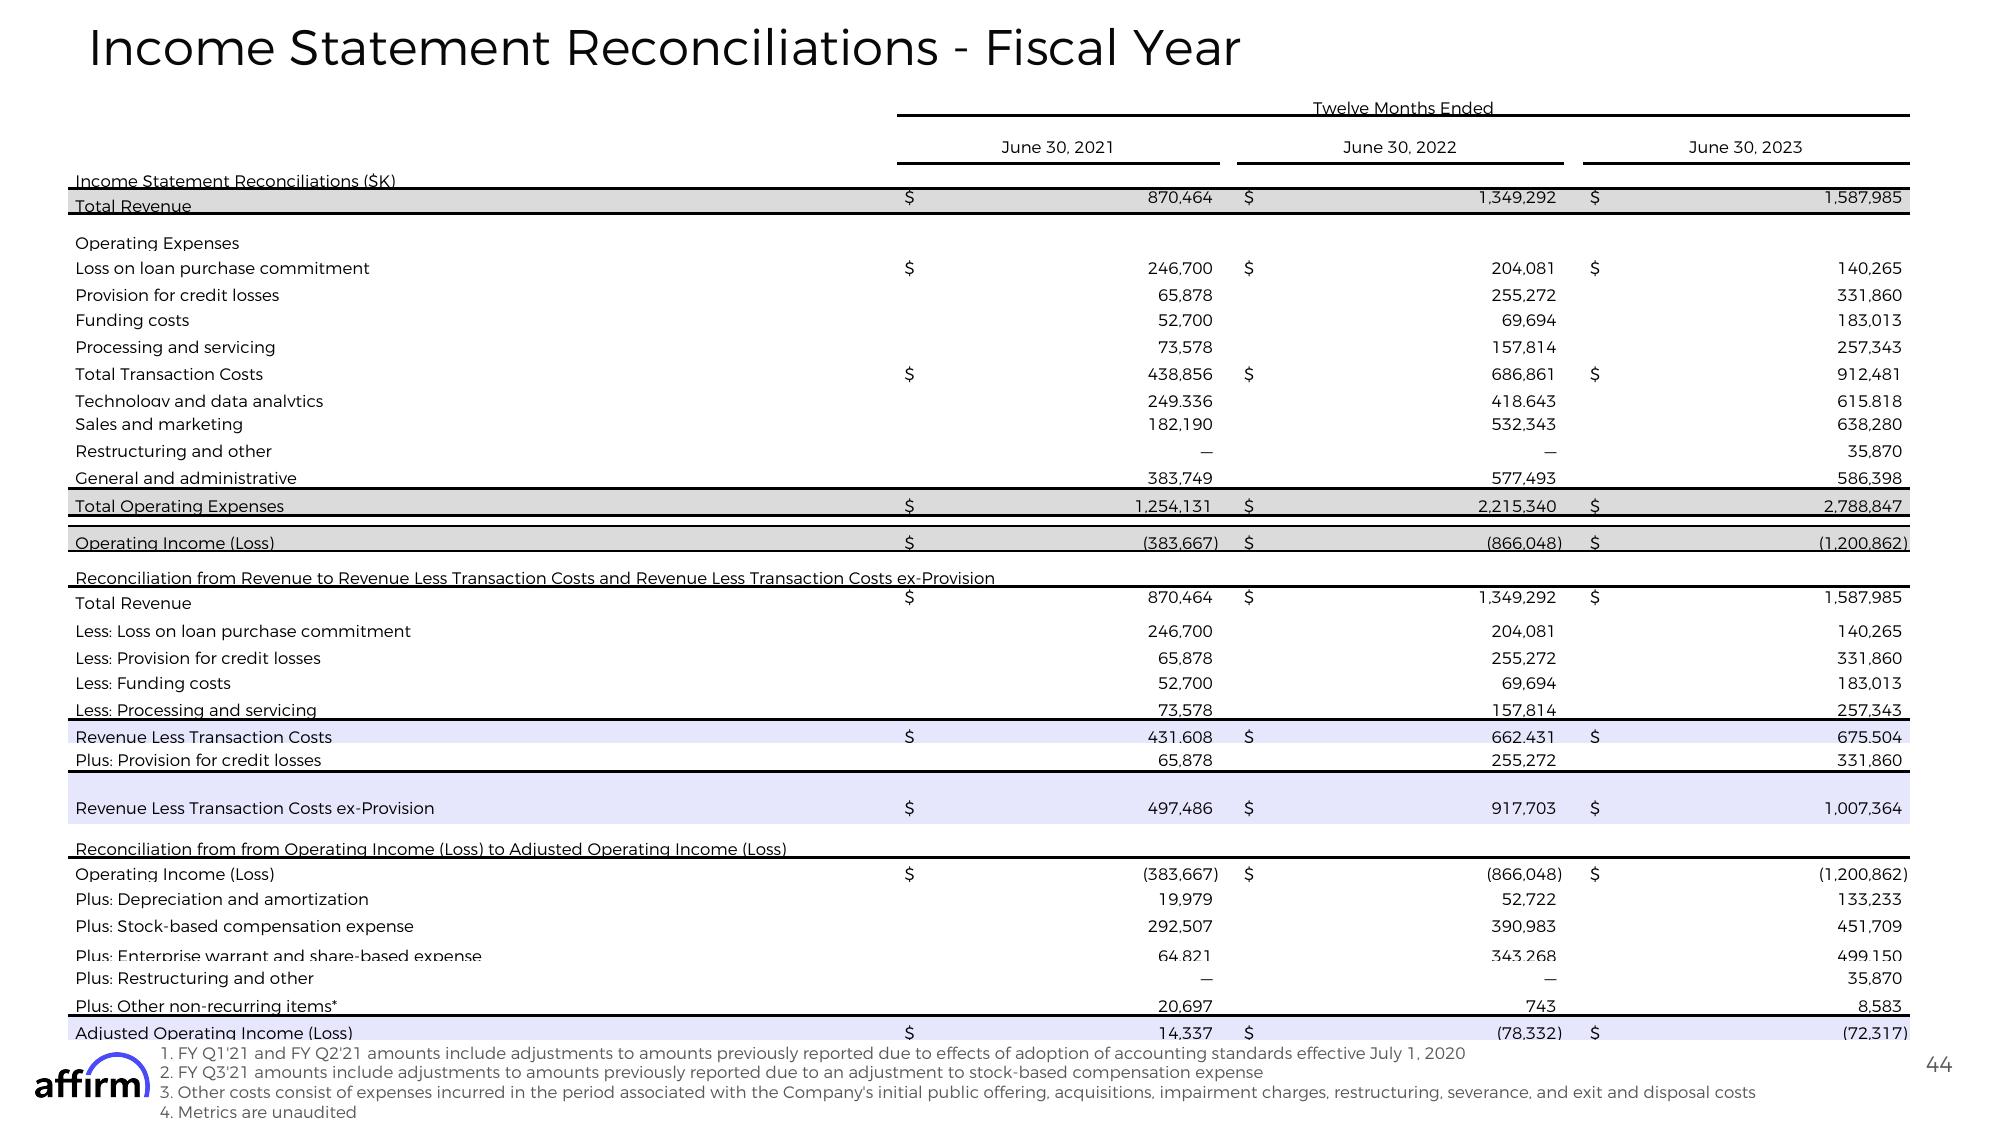
Income Statement Reconciliations - Fiscal Year
Income Statement Reconciliations (SK)
Total Revenue
Operating Expenses
Loss on loan purchase commitment
Provision for credit losses
Funding costs
Processing and servicing
Total Transaction Costs
Technoloav and data analvtics
Sales and marketing
Restructuring and other
General and administrative
Total Operating Expenses
Operating Income (Loss)
Revenue Less Transaction Costs
Plus: Provision for credit losses
Revenue Less Transaction Costs ex-Provision
Reconciliation from Revenue to Revenue Less Transaction Costs and Revenue Less Transaction Costs ex-Provision
Total Revenue
$
Less: Loss on loan purchase commitment
Less: Provision for credit losses
Less: Funding costs
Less: Processing and servicing
Reconciliation from from Operating Income (Loss) to Adjusted Operating Income (Loss)
Operating Income (Loss)
Plus: Depreciation and amortization
Plus: Stock-based compensation expense
$
Plus: Enterprise warrant and share-based expense
Plus: Restructuring and other
Plus: Other non-recurring items*
$
$
Ś
Ś
$
$
June 30, 2021
870,464
246,700 $
65,878
52,700
73,578
438,856
249.336
182,190
383,749
1,254,131
(383,667)
497.486
$
67)
19,979
292,507
64.821
$
Ś
870,464
246,700
65,878
52,700
73,578
431.608 Ś
65,878
$
$
Twelve Months Ended
June 30, 2022
1,349,292 $
204,081
255,272
69,694
157,814
686,861
418.643
532,343
577,493
2,215,340
(866,048)
1,349,292
204,081
255,272
69,694
157,814
662.431
255,272
917,703
(866,048)
52,722
390,983
343.268
$
$
$
$
$
$
$
743
(78.332) $
June 30, 2023
20,697
14,337 $
Adjusted Operating Income (Loss)
$
1. FY Q1'21 and FY Q2'21 amounts include adjustments to amounts previously reported due to effects of adoption of accounting standards effective July 1, 2020
2. FY Q3'21 amounts to amounts due to an
to
affirm) 3. Other costs consist of expenses incurred in the period associated with the Company's initial public offering, acquisitions, impairment charges, restructuring, severance, and exit and disposal costs
4. Metrics are unaudited
1,587,985
140,265
331,860
183,013
257,343
912,481
615.818
638,280
35,870
586,398
2,788,847
(1,200,862)
1,587,985
140,265
331,860
183,013
257,343
675.504
331,860
1,007,364
(1,200,8
133,233
451,709
499.150
35,870
8,583
(72,317)
44View entire presentation