IGI SPAC Presentation Deck
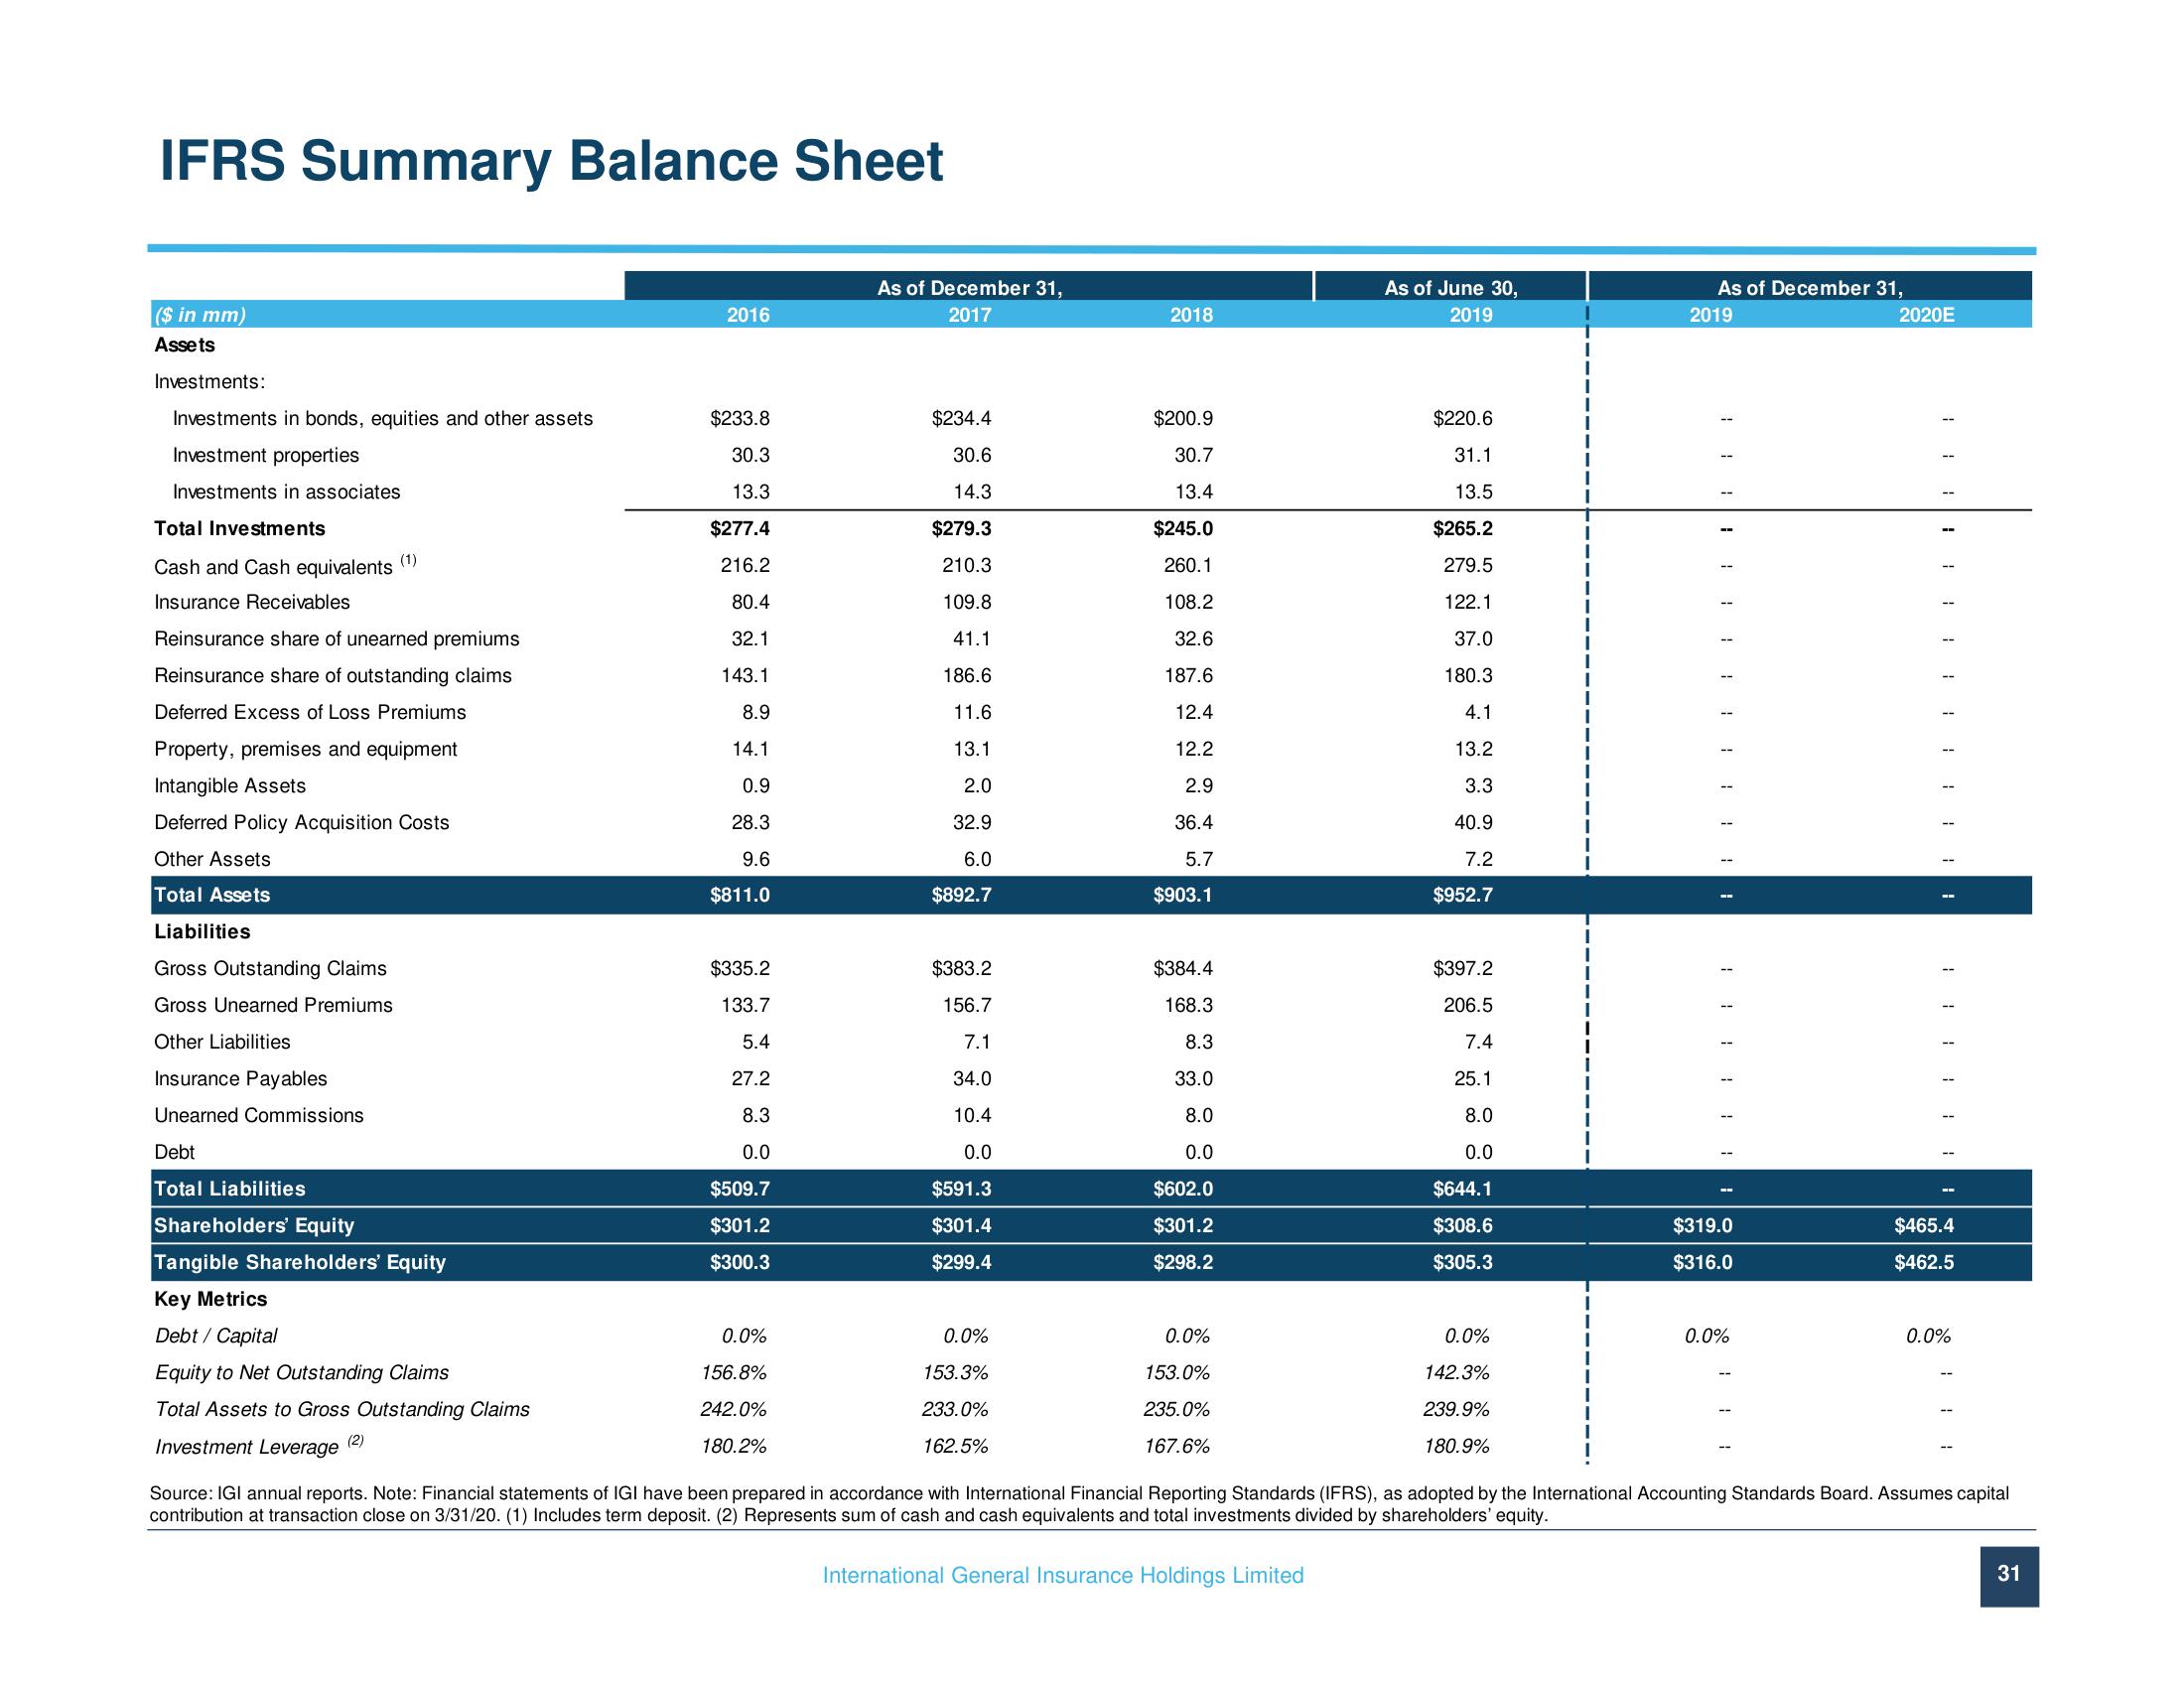
IFRS Summary Balance Sheet
($ in mm)
Assets
Investments:
Investments in bonds, equities and other assets
Investment properties
Investments in associates
Total Investments
Cash and Cash equivalents (1)
Insurance Receivables
Reinsurance share of unearned premiums
Reinsurance share of outstanding claims
Deferred Excess of Loss Premiums
Property, premises and equipment
Intangible Assets
Deferred Policy Acquisition Costs
Other Assets
Total Assets
Liabilities
Gross Outstanding Claims
Gross Unearned Premiums
Other Liabilities
Insurance Payables
Unearned Commissions
Debt
Total Liabilities
Shareholders' Equity
Tangible Shareholders' Equity
Key Metrics
Debt / Capital
Equity to Net Outstanding Claims
Total Assets to Gross Outstanding Claims
(2)
2016
$233.8
30.3
13.3
$277.4
216.2
80.4
32.1
143.1
8.9
14.1
0.9
28.3
9.6
$811.0
$335.2
133.7
5.4
27.2
8.3
0.0
$509.7
$301.2
$300.3
0.0%
156.8%
242.0%
180.2%
As of December 31,
2017
$234.4
30.6
14.3
$279.3
210.3
109.8
41.1
186.6
11.6
13.1
2.0
32.9
6.0
$892.7
$383.2
156.7
7.1
34.0
10.4
0.0
$591.3
$301.4
$299.4
0.0%
153.3%
233.0%
162.5%
2018
$200.9
30.7
13.4
$245.0
260.1
108.2
32.6
187.6
12.4
12.2
2.9
36.4
5.7
$903.1
$384.4
168.3
8.3
33.0
8.0
0.0
$602.0
$301.2
$298.2
0.0%
153.0%
235.0%
167.6%
As of June 30,
2019
$220.6
31.1
13.5
$265.2
279.5
122.1
37.0
180.3
4.1
13.2
3.3
40.9
7.2
$952.7
$397.2
206.5
7.4
25.1
8.0
0.0
$644.1
$308.6
$305.3
0.0%
142.3%
239.9%
180.9%
As of December 31,
2019
$319.0
$316.0
0.0%
2020E
$465.4
$462.5
0.0%
Investment Leverage
Source: IGI annual reports. Note: Financial statements of IGI have been prepared in accordance with International Financial Reporting Standards (IFRS), as adopted by the International Accounting Standards Board. Assumes capital
contribution at transaction close on 3/31/20. (1) Includes term deposit. (2) Represents sum of cash and cash equivalents and total investments divided by shareholders' equity.
International General Insurance Holdings Limited
31View entire presentation